The Hartford 2010 Annual Report Download - page 109
Download and view the complete annual report
Please find page 109 of the 2010 The Hartford annual report below. You can navigate through the pages in the report by either clicking on the pages listed below, or by using the keyword search tool below to find specific information within the annual report.-
 1
1 -
2
-
3
-
4
-
5
-
6
-
7
-
8
-
9
-
10
-
11
-
12
-
13
-
14
-
15
-
16
-
17
-
18
-
19
-
20
-
21
-
22
-
23
-
24
-
25
-
26
-
27
-
28
-
29
-
30
-
31
-
32
-
33
-
34
-
35
-
36
-
37
-
38
-
39
-
40
-
41
-
42
-
43
-
44
-
45
-
46
-
47
-
48
-
49
-
50
-
51
-
52
-
53
-
54
-
55
-
56
-
57
-
58
-
59
-
60
-
61
-
62
-
63
-
64
-
65
-
66
-
67
-
68
-
69
-
70
-
71
-
72
-
73
-
74
-
75
-
76
-
77
-
78
-
79
-
80
-
81
-
82
-
83
-
84
-
85
-
86
-
87
-
88
-
89
-
90
-
91
-
92
-
93
-
94
-
95
-
96
-
97
-
98
-
 99
99 -
 100
100 -
 101
101 -
 102
102 -
 103
103 -
 104
104 -
 105
105 -
 106
106 -
 107
107 -
 108
108 -
 109
109 -
 110
110 -
 111
111 -
 112
112 -
 113
113 -
 114
114 -
 115
115 -
 116
116 -
 117
117 -
 118
118 -
 119
119 -
120
-
121
-
122
-
123
-
124
-
125
-
126
-
127
-
128
-
129
-
130
-
131
-
132
-
133
-
134
-
135
-
136
-
137
-
138
-
139
-
140
-
141
-
142
-
143
-
144
-
145
-
146
-
147
-
148
-
149
-
150
-
151
-
152
-
153
-
154
-
155
-
156
-
157
-
158
-
159
-
160
-
161
-
162
-
163
-
164
-
165
-
166
-
167
-
168
-
169
-
170
-
171
-
172
-
173
-
174
-
175
-
176
-
177
-
178
-
179
-
180
-
181
-
182
-
183
-
184
-
185
-
186
-
187
-
188
-
189
-
190
-
191
-
192
-
193
-
194
-
195
-
196
-
197
-
198
-
199
-
200
-
201
-
202
-
203
-
204
-
205
-
206
-
207
-
208
-
209
-
210
-
211
-
212
-
213
-
214
-
215
-
216
-
217
-
218
-
219
-
220
-
221
-
222
-
223
-
224
-
225
-
226
-
227
-
228
-
229
-
230
-
231
-
232
-
233
-
234
-
235
-
236
-
237
-
238
-
239
-
240
-
241
-
242
-
243
-
244
-
245
-
246
-
247
-
248
 |
 |

109
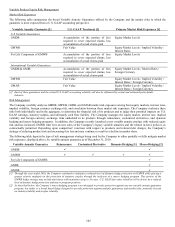
Derivative Instruments
The Company utilizes a variety of derivative instruments, including swaps, caps, floors, forwards, futures and options through one of
four Company-approved objectives: to hedge risk arising from interest rate, equity market, credit spread including issuer default, price
or currency exchange rate risk or volatility; to manage liquidity; to control transaction costs; or to enter into replication transactions.
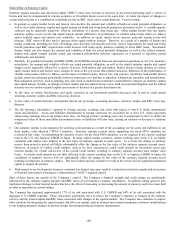
Downgrades to the credit ratings of The Hartford’ s insurance operating companies may have adverse implications for its use of
derivatives including those used to hedge benefit guarantees of variable annuities. In some cases, further downgrades may give
derivative counterparties the unilateral contractual right to cancel and settle outstanding derivative trades or require additional collateral
to be posted. In addition, further downgrades may result in counterparties becoming unwilling to engage in additional over-the-counter
(“OTC”) derivatives or may require collateralization before entering into any new trades. This will restrict the supply of derivative
instruments commonly used to hedge variable annuity guarantees, particularly long-dated equity derivatives and interest rate swaps.
Under these circumstances, The Hartford’ s operating subsidiaries could conduct hedging activity using a combination of cash and
exchange-traded instruments, in addition to using the available OTC derivatives.
Foreign Currency Exchange Risk
The Company’ s foreign currency exchange risk is related to non–U.S. dollar denominated investments, which primarily consist of fixed
maturity investments, the investment in and net income of the Japanese and U.K. operations, and non-U.S. dollar denominated liability
contracts, including its GMDB, GMAB, GMWB and GMIB benefits associated with its Japanese and U.K. variable annuities, and a yen
denominated individual fixed annuity product. Also, foreign currency exchange rate risk is inherent when the Japan policyholders’
variable annuity sub-account investments are non-Japanese yen denominated securities while the related GMDB and GMIB guarantees
are effectively yen-denominated. A portion of the Company’ s foreign currency exposure is mitigated through the use of derivatives.
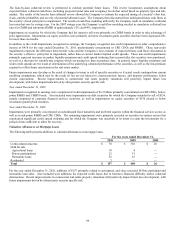
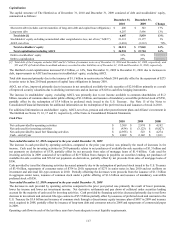
Fixed Maturity Investments
The risk associated with the non-U.S. dollar denominated fixed maturities relates to potential decreases in value and income resulting
from unfavorable changes in foreign exchange rates. The fair value of the non-U.S. dollar denominated fixed maturities, which are
primarily denominated in euro, sterling, yen and Canadian dollars, at December 31, 2010 and 2009, were approximately $1.4 billion and
$1.2 billion, respectively.
In order to manage its currency exposures, the Company enters into foreign currency swaps and forwards to hedge the variability in cash
flows as fair value associated with certain foreign denominated fixed maturities. These foreign currency swap and forward agreements
are structured to match the foreign currency cash flows of the hedged foreign denominated securities. At December 31, 2010 and 2009,
the derivatives used to hedge currency exchange risk related to non-U.S. dollar denominated fixed maturities had a total notional
amount of $431 and $480, respectively, and total fair value of $(6) and $(26), respectively.
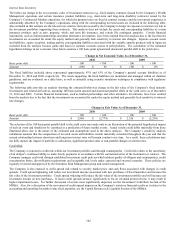
Based on the fair values of the Company’ s non-U.S. dollar denominated securities and derivative instruments as of December 31, 2010
and 2009, management estimates that a 10% unfavorable change in exchange rates would decrease the fair values by a before-tax total
of approximately $87 and $62, respectively. The estimated impact was based upon a 10% change in December 31 spot rates. The
selection of the 10% unfavorable change was made only for illustration of the potential hypothetical impact of such an event and should
not be construed as a prediction of future market events. Actual results could differ materially from those illustrated above due to the
nature of the estimates and assumptions used in the above analysis.