The Hartford 2010 Annual Report Download - page 149
Download and view the complete annual report
Please find page 149 of the 2010 The Hartford annual report below. You can navigate through the pages in the report by either clicking on the pages listed below, or by using the keyword search tool below to find specific information within the annual report.-
 1
1 -
2
-
3
-
4
-
5
-
6
-
7
-
8
-
9
-
10
-
11
-
12
-
13
-
14
-
15
-
16
-
17
-
18
-
19
-
20
-
21
-
22
-
23
-
24
-
25
-
26
-
27
-
28
-
29
-
30
-
31
-
32
-
33
-
34
-
35
-
36
-
37
-
38
-
39
-
40
-
41
-
42
-
43
-
44
-
45
-
46
-
47
-
48
-
49
-
50
-
51
-
52
-
53
-
54
-
55
-
56
-
57
-
58
-
59
-
60
-
61
-
62
-
63
-
64
-
65
-
66
-
67
-
68
-
69
-
70
-
71
-
72
-
73
-
74
-
75
-
76
-
77
-
78
-
79
-
80
-
81
-
82
-
83
-
84
-
85
-
86
-
87
-
88
-
89
-
90
-
91
-
92
-
93
-
94
-
95
-
96
-
97
-
98
-
99
-
100
-
101
-
102
-
103
-
104
-
105
-
106
-
107
-
108
-
109
-
110
-
111
-
112
-
113
-
114
-
115
-
116
-
117
-
118
-
119
-
120
-
121
-
122
-
123
-
124
-
125
-
126
-
127
-
128
-
129
-
130
-
131
-
132
-
133
-
134
-
135
-
136
-
137
-
138
-
 139
139 -
 140
140 -
 141
141 -
 142
142 -
 143
143 -
 144
144 -
 145
145 -
 146
146 -
 147
147 -
 148
148 -
 149
149 -
 150
150 -
 151
151 -
 152
152 -
 153
153 -
 154
154 -
 155
155 -
 156
156 -
 157
157 -
 158
158 -
 159
159 -
160
-
161
-
162
-
163
-
164
-
165
-
166
-
167
-
168
-
169
-
170
-
171
-
172
-
173
-
174
-
175
-
176
-
177
-
178
-
179
-
180
-
181
-
182
-
183
-
184
-
185
-
186
-
187
-
188
-
189
-
190
-
191
-
192
-
193
-
194
-
195
-
196
-
197
-
198
-
199
-
200
-
201
-
202
-
203
-
204
-
205
-
206
-
207
-
208
-
209
-
210
-
211
-
212
-
213
-
214
-
215
-
216
-
217
-
218
-
219
-
220
-
221
-
222
-
223
-
224
-
225
-
226
-
227
-
228
-
229
-
230
-
231
-
232
-
233
-
234
-
235
-
236
-
237
-
238
-
239
-
240
-
241
-
242
-
243
-
244
-
245
-
246
-
247
-
248
 |
 |
THE HARTFORD FINANCIAL SERVICES GROUP, INC.
NOTES TO CONSOLIDATED FINANCIAL STATEMENTS (continued)
F-21
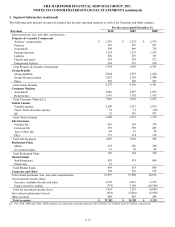
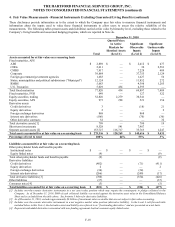
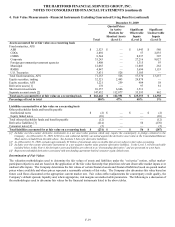
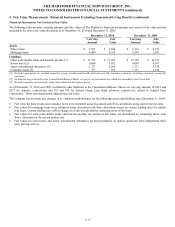
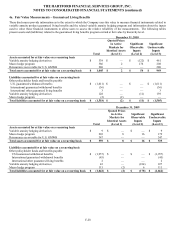
4. Fair Value Measurements – Financial Instruments Excluding Guaranteed Living Benefits (continued)
Derivative Instruments, including embedded derivatives within investments
Derivative instruments are fair valued using pricing valuation models; that utilize independent market data inputs, quoted market prices
for exchange-traded derivatives, or independent broker quotations. Excluding embedded and reinsurance related derivatives, as of
December 31, 2010 and 2009, 97% of derivatives, based upon notional values, were priced by valuation models or quoted market prices.
The remaining derivatives were priced by broker quotations. The Company performs a monthly analysis on derivative valuations which
includes both quantitative and qualitative analysis. Examples of procedures performed include, but are not limited to, review of pricing
statistics and trends, back testing recent trades, analyzing the impacts of changes in the market environment, and review of changes in
market value for each derivative including those derivatives priced by brokers.
The Company utilizes derivative instruments to manage the risk associated with certain assets and liabilities. However, the derivative
instrument may not be classified with the same fair value hierarchy level as the associated assets and liabilities. Therefore the realized
and unrealized gains and losses on derivatives reported in Level 3 may not reflect the offsetting impact of the realized and unrealized
gains and losses of the associated assets and liabilities.
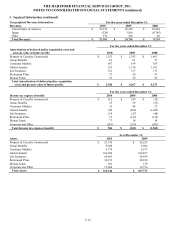
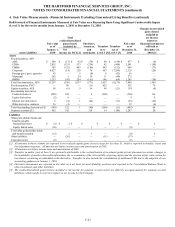
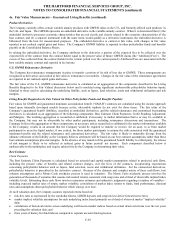
Valuation Techniques and Inputs for Investments
Generally, the Company determines the estimated fair value of its AFS securities, fixed maturities, FVO, equity securities, trading, and
short-term investments using the market approach. The income approach is used for securities priced using a pricing matrix, as well as
for derivative instruments. For Level 1 investments, which are comprised of on-the-run U.S. Treasuries, exchange-traded equity
securities, short-term investments, and exchange traded futures and option contracts, valuations are based on observable inputs that
reflect quoted prices for identical assets in active markets that the Company has the ability to access at the measurement date.
For most of the Company’ s debt securities, the following inputs are typically used in the Company’ s pricing methods: reported trades,
benchmark yields, bids and/or estimated cash flows. For securities except U.S. Treasuries, inputs also include issuer spreads, which may
consider credit default swaps. Derivative instruments are valued using mid-market inputs that are predominantly observable in the
market.
A description of additional inputs used in the Company’ s Level 2 and Level 3 measurements is listed below:
Level 2 The fair values of most of the Company’ s Level 2 investments are determined by management after considering prices
received from third party pricing services. These investments include most fixed maturities and preferred stocks, including
those reported in separate account assets.
• ABS, CDOs, CMBS and RMBS – Primary inputs also include monthly payment information, collateral performance,
which varies by vintage year and includes delinquency rates, collateral valuation loss severity rates, collateral
refinancing assumptions, credit default swap indices and, for ABS and RMBS, estimated prepayment rates.
• Corporates – Primary inputs also include observations of credit default swap curves related to the issuer.
• Foreign government/government agencies - Primary inputs also include observations of credit default swap curves
related to the issuer and political events in emerging markets.
• Municipals – Primary inputs also include Municipal Securities Rulemaking Board reported trades and material event
notices, and issuer financial statements.
• Short-term investments – Primary inputs also include material event notices and new issue money market rates.
• Equity securities, trading – Consist of investments in mutual funds. Primary inputs include net asset values obtained
from third party pricing services.
• Credit derivatives – Significant inputs primarily include the swap yield curve and credit curves.
• Foreign exchange derivatives – Significant inputs primarily include the swap yield curve, currency spot and forward
rates, and cross currency basis curves.
• Interest rate derivatives – Significant input is primarily the swap yield curve.