The Hartford 2010 Annual Report Download - page 178
Download and view the complete annual report
Please find page 178 of the 2010 The Hartford annual report below. You can navigate through the pages in the report by either clicking on the pages listed below, or by using the keyword search tool below to find specific information within the annual report.-
 1
1 -
2
-
3
-
4
-
5
-
6
-
7
-
8
-
9
-
10
-
11
-
12
-
13
-
14
-
15
-
16
-
17
-
18
-
19
-
20
-
21
-
22
-
23
-
24
-
25
-
26
-
27
-
28
-
29
-
30
-
31
-
32
-
33
-
34
-
35
-
36
-
37
-
38
-
39
-
40
-
41
-
42
-
43
-
44
-
45
-
46
-
47
-
48
-
49
-
50
-
51
-
52
-
53
-
54
-
55
-
56
-
57
-
58
-
59
-
60
-
61
-
62
-
63
-
64
-
65
-
66
-
67
-
68
-
69
-
70
-
71
-
72
-
73
-
74
-
75
-
76
-
77
-
78
-
79
-
80
-
81
-
82
-
83
-
84
-
85
-
86
-
87
-
88
-
89
-
90
-
91
-
92
-
93
-
94
-
95
-
96
-
97
-
98
-
99
-
100
-
101
-
102
-
103
-
104
-
105
-
106
-
107
-
108
-
109
-
110
-
111
-
112
-
113
-
114
-
115
-
116
-
117
-
118
-
119
-
120
-
121
-
122
-
123
-
124
-
125
-
126
-
127
-
128
-
129
-
130
-
131
-
132
-
133
-
134
-
135
-
136
-
137
-
138
-
139
-
140
-
141
-
142
-
143
-
144
-
145
-
146
-
147
-
148
-
149
-
150
-
151
-
152
-
153
-
154
-
155
-
156
-
157
-
158
-
159
-
160
-
161
-
162
-
163
-
164
-
165
-
166
-
167
-
 168
168 -
 169
169 -
 170
170 -
 171
171 -
 172
172 -
 173
173 -
 174
174 -
 175
175 -
 176
176 -
 177
177 -
 178
178 -
 179
179 -
 180
180 -
 181
181 -
 182
182 -
 183
183 -
 184
184 -
 185
185 -
 186
186 -
 187
187 -
 188
188 -
189
-
190
-
191
-
192
-
193
-
194
-
195
-
196
-
197
-
198
-
199
-
200
-
201
-
202
-
203
-
204
-
205
-
206
-
207
-
208
-
209
-
210
-
211
-
212
-
213
-
214
-
215
-
216
-
217
-
218
-
219
-
220
-
221
-
222
-
223
-
224
-
225
-
226
-
227
-
228
-
229
-
230
-
231
-
232
-
233
-
234
-
235
-
236
-
237
-
238
-
239
-
240
-
241
-
242
-
243
-
244
-
245
-
246
-
247
-
248
 |
 |
THE HARTFORD FINANCIAL SERVICES GROUP, INC.
NOTES TO CONSOLIDATED FINANCIAL STATEMENTS (continued)
F-50
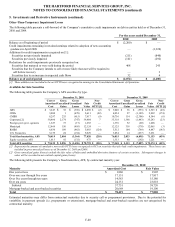
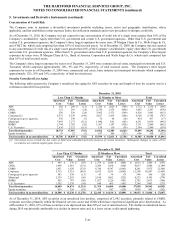
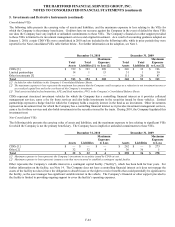
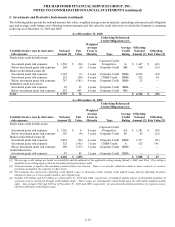
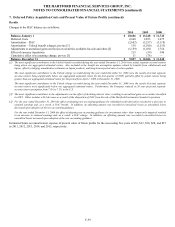
5. Investments and Derivative Instruments (continued)
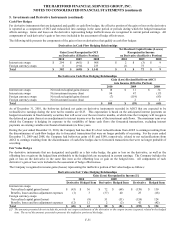
Change in Notional Amount
The net decrease in notional amount of derivatives since December 31, 2009, was primarily due to the following:
• The Company terminated $6.4 billion notional of forward rate agreements as a result of the sale of the hedged variable rate
securities. The $6.4 billion notional was comprised of a series of one month forward contracts that were hedging the variability of
cash flows related to coupon payments on $555 of variable rate securities for consecutive monthly periods during 2010.
• The GMWB product derivative notional declined $4.6 billion primarily as a result of policyholder lapses and withdrawals, partially
offset by an increase in the equity market.
• The notional amount related to interest rate swaps that qualify for cash flow hedge accounting, which are used to convert interest
receipts on floating-rate fixed maturity securities to fixed rates, declined $1.3 billion due to swap maturities.
• The notional amount related to the macro hedge program declined $1.2 billion primarily due to the expiration of certain equity
index options during the first quarter.
• The notional amount related to credit derivatives in offsetting positions increased by $2.2 billion primarily due to purchases and
terminations during the year of credit derivatives that were purchasing credit protection.
• The notional amount related to credit derivatives that assume credit risk increased by $1.4 billion as a result of the Company adding
$676 notional which reference to a standard market basket of corporate issuers to manage credit spread duration, $463 notional
related to the bifurcation of certain embedded credit derivatives as a result of new accounting guidance, and $342 related to the
consolidation of a VIE as a result of new accounting guidance. For further discussion of the new accounting guidance on embedded
credit derivatives and VIEs adopted during 2010, see Adoption of New Accounting Standards in Note 1.
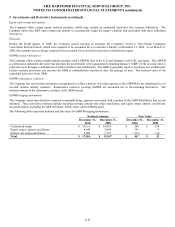
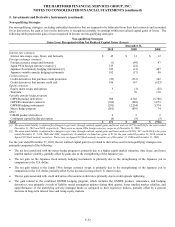
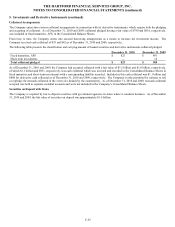
Change in Fair Value
The change in the total fair value of derivative instruments since December 31, 2009, was primarily related to the following:
• The increase in the combined GMWB hedging program, which includes the GMWB product, reinsurance, and hedging derivatives,
was primarily a result of purchases of equity options, liability model assumption updates during third quarter, lower implied market
volatility, and outperformance of the underlying actively managed funds as compared to their respective indices, partially offset by
a general decrease in long-term interest rates and rising equity markets.
• The increase in fair value related to the Japanese fixed annuity hedging instruments and Japan 3 Win foreign currency swaps was
primarily due to the U.S. dollar weakening in comparison to the Japanese yen, partially offset by a decrease in fair value of the
Japan 3 Win foreign currency swaps due to a decrease in long-term U.S. interest rates.
• The fair value related to interest rate swaps decreased as a result of a portfolio rebalancing program.
• The fair value related to credit derivatives that assume credit risk primarily decreased as a result of the Company adopting new
accounting guidance related to the consolidation of VIEs; see Adoption of New Accounting Standards in Note 1. As a result of this
new guidance, the Company has consolidated a Company sponsored CDO that included credit default swaps with a notional
amount of $342 and a fair value of $(250) as of December 31, 2010. These swaps reference a basket of corporate issuers.