The Hartford 2010 Annual Report Download - page 86
Download and view the complete annual report
Please find page 86 of the 2010 The Hartford annual report below. You can navigate through the pages in the report by either clicking on the pages listed below, or by using the keyword search tool below to find specific information within the annual report.-
 1
1 -
2
-
3
-
4
-
5
-
6
-
7
-
8
-
9
-
10
-
11
-
12
-
13
-
14
-
15
-
16
-
17
-
18
-
19
-
20
-
21
-
22
-
23
-
24
-
25
-
26
-
27
-
28
-
29
-
30
-
31
-
32
-
33
-
34
-
35
-
36
-
37
-
38
-
39
-
40
-
41
-
42
-
43
-
44
-
45
-
46
-
47
-
48
-
49
-
50
-
51
-
52
-
53
-
54
-
55
-
56
-
57
-
58
-
59
-
60
-
61
-
62
-
63
-
64
-
65
-
66
-
67
-
68
-
69
-
70
-
71
-
72
-
73
-
74
-
75
-
 76
76 -
 77
77 -
 78
78 -
 79
79 -
 80
80 -
 81
81 -
 82
82 -
 83
83 -
 84
84 -
 85
85 -
 86
86 -
 87
87 -
 88
88 -
 89
89 -
 90
90 -
 91
91 -
 92
92 -
 93
93 -
 94
94 -
 95
95 -
 96
96 -
97
-
98
-
99
-
100
-
101
-
102
-
103
-
104
-
105
-
106
-
107
-
108
-
109
-
110
-
111
-
112
-
113
-
114
-
115
-
116
-
117
-
118
-
119
-
120
-
121
-
122
-
123
-
124
-
125
-
126
-
127
-
128
-
129
-
130
-
131
-
132
-
133
-
134
-
135
-
136
-
137
-
138
-
139
-
140
-
141
-
142
-
143
-
144
-
145
-
146
-
147
-
148
-
149
-
150
-
151
-
152
-
153
-
154
-
155
-
156
-
157
-
158
-
159
-
160
-
161
-
162
-
163
-
164
-
165
-
166
-
167
-
168
-
169
-
170
-
171
-
172
-
173
-
174
-
175
-
176
-
177
-
178
-
179
-
180
-
181
-
182
-
183
-
184
-
185
-
186
-
187
-
188
-
189
-
190
-
191
-
192
-
193
-
194
-
195
-
196
-
197
-
198
-
199
-
200
-
201
-
202
-
203
-
204
-
205
-
206
-
207
-
208
-
209
-
210
-
211
-
212
-
213
-
214
-
215
-
216
-
217
-
218
-
219
-
220
-
221
-
222
-
223
-
224
-
225
-
226
-
227
-
228
-
229
-
230
-
231
-
232
-
233
-
234
-
235
-
236
-
237
-
238
-
239
-
240
-
241
-
242
-
243
-
244
-
245
-
246
-
247
-
248
 |
 |

86
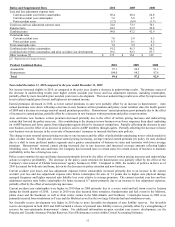
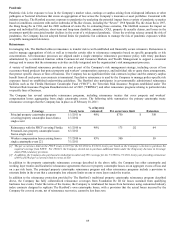
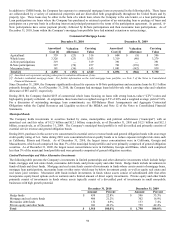
MUTUAL FUNDS
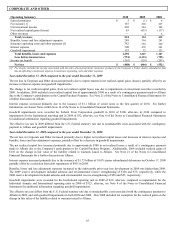
Operating Summary 2010 2009 2008
Fee income and other $ 690 $ 518 $ 666
Net investment loss (8) (21) (22)
Net realized capital gains (loss) 69 — (1)
Total revenues 751 497 643
Insurance operating costs and other expenses 480 395 491
Amortization of DAC 62 50 96
Total benefits, losses and expenses 542 445 587
Income before income taxes 209 52 56
Income tax expense 77 18 19
Net income $ 132
$
34
$
37
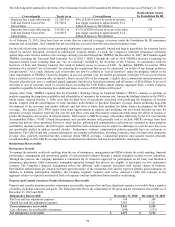
Assets Under Management 2010 2009 2008
Retail mutual fund assets $48,753 $ 42,829 $31,032
Investment Only mutual fund assets [1] 6,659 — —
529 College Savings Plan and Canadian mutual fund assets [1] 1,472 1,202 1,678
Total non-proprietary and Canadian mutual fund assets 56,884 44,031 32,710
Proprietary mutual fund assets [2] 43,602 — —
Total mutual fund assets under management $100,486 $ 44,031 $32,710
Non-Proprietary and Canadian Mutual Fund AUM Roll Forward 2010 2009 2008
Non-Proprietary and Canadian Mutual Fund AUM, beginning of period $44,031 $ 32,710 $50,496
Transfers in (out) [1] 5,617 (826) —
Net flows 2,750 2,115 3,171
Change in market value and other [3] 4,486 10,032 (20,957)
Non-Proprietary and Canadian Mutual Fund AUM, end of period $56,884 $ 44,031 $32,710
Proprietary Mutual Fund AUM Roll Forward 2010 2009 2008
Proprietary Mutual Fund AUM, beginning of period $— $ — $ —
Transfers in [2] 43,890 — —
Net flows (5,334) — —
Change in market value 5,046 — —
Proprietary Mutual Fund AUM, end of period $43,602 $ — $ —
[1] In 2009, Canadian mutual fund assets were transferred from Mutual Funds to Global Annuity effective January 1, 2009. In 2010, Investment
Only and Canadian mutual fund assets were transferred to Mutual Funds from Global Annuity effective January 1, 2010.
[2] Proprietary mutual fund assets under management are included in the Mutual Fund reporting segment effective January 1, 2010.
[3] Change in market value and other in 2010 includes the sale of Canadian mutual fund assets of approximately $1.8 billion.
Year ended December 31, 2010 compared to the year ended December 31, 2009
Net income increased in 2010 compared to 2009 primarily due to net realized gain on the sale of Canadian mutual fund operations of
$69, pre-tax, and higher overall account balances attributed to the improved equity markets, and positive net flows on non-proprietary
and Canadian mutual fund assets, resulting in higher fee income, partially offset by higher trail commissions, as well as capital infusions
to the money market funds. Also contributing to the net income in 2010 is the increase in scale of the reporting segment’ s businesses.
Year ended December 31, 2009 compared to the year ended December 31, 2008
Net income decreased in 2009 compared to 2008 primarily due to lower fee income and other driven by lower average account values.
Despite equity market improvements during the last nine months of 2009, account values did not return to early 2008 levels. Also
contributing to the net income in 2009 is the decrease in scale of the reporting segment’ s businesses.