The Hartford 2010 Annual Report Download - page 100
Download and view the complete annual report
Please find page 100 of the 2010 The Hartford annual report below. You can navigate through the pages in the report by either clicking on the pages listed below, or by using the keyword search tool below to find specific information within the annual report.-
 1
1 -
2
-
3
-
4
-
5
-
6
-
7
-
8
-
9
-
10
-
11
-
12
-
13
-
14
-
15
-
16
-
17
-
18
-
19
-
20
-
21
-
22
-
23
-
24
-
25
-
26
-
27
-
28
-
29
-
30
-
31
-
32
-
33
-
34
-
35
-
36
-
37
-
38
-
39
-
40
-
41
-
42
-
43
-
44
-
45
-
46
-
47
-
48
-
49
-
50
-
51
-
52
-
53
-
54
-
55
-
56
-
57
-
58
-
59
-
60
-
61
-
62
-
63
-
64
-
65
-
66
-
67
-
68
-
69
-
70
-
71
-
72
-
73
-
74
-
75
-
76
-
77
-
78
-
79
-
80
-
81
-
82
-
83
-
84
-
85
-
86
-
87
-
88
-
89
-
 90
90 -
 91
91 -
 92
92 -
 93
93 -
 94
94 -
 95
95 -
 96
96 -
 97
97 -
 98
98 -
 99
99 -
 100
100 -
 101
101 -
 102
102 -
 103
103 -
 104
104 -
 105
105 -
 106
106 -
 107
107 -
 108
108 -
 109
109 -
 110
110 -
111
-
112
-
113
-
114
-
115
-
116
-
117
-
118
-
119
-
120
-
121
-
122
-
123
-
124
-
125
-
126
-
127
-
128
-
129
-
130
-
131
-
132
-
133
-
134
-
135
-
136
-
137
-
138
-
139
-
140
-
141
-
142
-
143
-
144
-
145
-
146
-
147
-
148
-
149
-
150
-
151
-
152
-
153
-
154
-
155
-
156
-
157
-
158
-
159
-
160
-
161
-
162
-
163
-
164
-
165
-
166
-
167
-
168
-
169
-
170
-
171
-
172
-
173
-
174
-
175
-
176
-
177
-
178
-
179
-
180
-
181
-
182
-
183
-
184
-
185
-
186
-
187
-
188
-
189
-
190
-
191
-
192
-
193
-
194
-
195
-
196
-
197
-
198
-
199
-
200
-
201
-
202
-
203
-
204
-
205
-
206
-
207
-
208
-
209
-
210
-
211
-
212
-
213
-
214
-
215
-
216
-
217
-
218
-
219
-
220
-
221
-
222
-
223
-
224
-
225
-
226
-
227
-
228
-
229
-
230
-
231
-
232
-
233
-
234
-
235
-
236
-
237
-
238
-
239
-
240
-
241
-
242
-
243
-
244
-
245
-
246
-
247
-
248
 |
 |

100
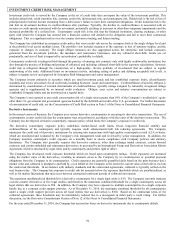
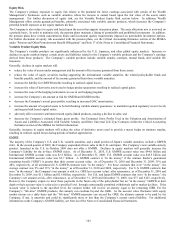
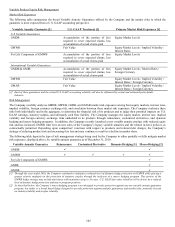
CAPITAL MARKETS RISK MANAGEMENT
The Company has a disciplined approach to managing risks associated with its capital markets and asset/liability management activities.
Investment portfolio management is organized to focus investment management expertise on specific classes of investments. The
Company invests in various types of investments, including derivative instruments, in order to meet its portfolio objectives. Derivative
instruments are utilized in compliance with established Company policy and regulatory requirements and are monitored internally and
reviewed by senior management.
The Company utilizes a variety of over-the-counter and exchange traded derivative instruments as a part of its overall risk management
strategy, as well as to enter into replication transactions. Derivative instruments are used to manage risk associated with interest rate,
equity market, credit spread, issuer default, price, and currency exchange rate risk or volatility. Replication transactions are used as an
economical means to synthetically replicate the characteristics and performance of assets that would otherwise be permissible
investments under the Company’ s investment policies. For further information, see Note 5 of the Notes to Consolidated Financial
Statements.
Derivative activities are monitored and evaluated by the Company’ s compliance and risk management teams and reviewed by senior
management. In addition, the Company monitors counterparty credit exposure on a monthly basis to ensure compliance with Company
policies and statutory limitations. The notional amounts of derivative contracts represent the basis upon which pay or receive amounts
are calculated and are not reflective of credit risk. For further information on the Company’ s use of derivatives, see Note 5 of the Notes
to Consolidated Financial Statements.
Market Risk
The Company is exposed to market risk associated with changes in interest rates, credit spreads including issuer defaults, equity prices
or market indices, and foreign currency exchange rates. The Company is also exposed to credit and counterparty repayment risk.
Derivative instruments are utilized in compliance with established Company policy and regulatory requirements and are monitored
internally and reviewed by senior management.
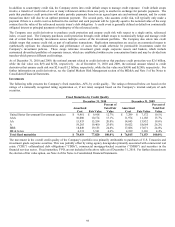
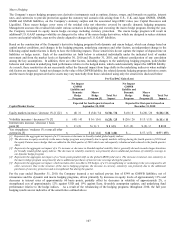
Interest Rate Risk
The Company manages its exposure to interest rate risk by constructing investment portfolios that maintain asset allocation limits and
asset/liability duration matching targets which may include the use of derivatives. The Company analyzes interest rate risk using
various models including parametric models and cash flow simulation under various market scenarios of the liabilities and their
supporting investment portfolios, which may include derivative instruments. Measures the Company uses to quantify its exposure to
interest rate risk inherent in its invested assets and interest rate sensitive liabilities include duration, convexity and key rate duration.
Duration is the price sensitivity of a financial instrument or series of cash flows to a parallel change in the underlying yield curve used
to value the financial instrument or series of cash flows. For example, a duration of 5 means the price of the security will change by
approximately 5% for a 100 basis point change in interest rates. Convexity is used to approximate how the duration of a security
changes as interest rates change in a parallel manner. Key rate duration analysis measures the price sensitivity of a security or series of
cash flows to each point along the yield curve and enables the Company to estimate the price change of a security assuming non-parallel
interest rate movements.
To calculate duration, convexity, and key rate durations, projections of asset and liability cash flows are discounted to a present value
using interest rate assumptions. These cash flows are then revalued at alternative interest rate levels to determine the percentage change
in fair value due to an incremental change in the entire yield curve for duration and convexity, or a particular point on the yield curve for
key rate duration. Cash flows from corporate obligations are assumed to be consistent with the contractual payment streams on a yield
to worst basis. Yield to worst is a basis that represents the lowest potential yield that can be received without the issuer actually
defaulting. The primary assumptions used in calculating cash flow projections include expected asset payment streams taking into
account prepayment speeds, issuer call options and contract holder behavior. Mortgage-backed and asset-backed securities are modeled
based on estimates of the rate of future prepayments of principal over the remaining life of the securities. These estimates are developed
by incorporating collateral surveillance and anticipated future market dynamics. Actual prepayment experience may vary from these
estimates.
The Company is also exposed to interest rate risk based upon the discount rate assumption associated with the Company’ s pension and
other postretirement benefit obligations. The discount rate assumption is based upon an interest rate yield curve comprised of bonds
rated Aa with maturities primarily between zero and thirty years. For further discussion of interest rate risk associated with the benefit
obligations, see the Critical Accounting Estimates Section of the MD&A under Pension and Other Postretirement Benefit Obligations
and Note 17 of the Notes to Consolidated Financial Statements. In addition, management evaluates performance of certain Wealth
Management products based on net investment spread which is, in part, influenced by changes in interest rates. For further discussion,
see the Global Annuity, Life Insurance, and Retirement Plans sections of the MD&A.