The Hartford 2010 Annual Report Download - page 210
Download and view the complete annual report
Please find page 210 of the 2010 The Hartford annual report below. You can navigate through the pages in the report by either clicking on the pages listed below, or by using the keyword search tool below to find specific information within the annual report.-
 1
1 -
2
-
3
-
4
-
5
-
6
-
7
-
8
-
9
-
10
-
11
-
12
-
13
-
14
-
15
-
16
-
17
-
18
-
19
-
20
-
21
-
22
-
23
-
24
-
25
-
26
-
27
-
28
-
29
-
30
-
31
-
32
-
33
-
34
-
35
-
36
-
37
-
38
-
39
-
40
-
41
-
42
-
43
-
44
-
45
-
46
-
47
-
48
-
49
-
50
-
51
-
52
-
53
-
54
-
55
-
56
-
57
-
58
-
59
-
60
-
61
-
62
-
63
-
64
-
65
-
66
-
67
-
68
-
69
-
70
-
71
-
72
-
73
-
74
-
75
-
76
-
77
-
78
-
79
-
80
-
81
-
82
-
83
-
84
-
85
-
86
-
87
-
88
-
89
-
90
-
91
-
92
-
93
-
94
-
95
-
96
-
97
-
98
-
99
-
100
-
101
-
102
-
103
-
104
-
105
-
106
-
107
-
108
-
109
-
110
-
111
-
112
-
113
-
114
-
115
-
116
-
117
-
118
-
119
-
120
-
121
-
122
-
123
-
124
-
125
-
126
-
127
-
128
-
129
-
130
-
131
-
132
-
133
-
134
-
135
-
136
-
137
-
138
-
139
-
140
-
141
-
142
-
143
-
144
-
145
-
146
-
147
-
148
-
149
-
150
-
151
-
152
-
153
-
154
-
155
-
156
-
157
-
158
-
159
-
160
-
161
-
162
-
163
-
164
-
165
-
166
-
167
-
168
-
169
-
170
-
171
-
172
-
173
-
174
-
175
-
176
-
177
-
178
-
179
-
180
-
181
-
182
-
183
-
184
-
185
-
186
-
187
-
188
-
189
-
190
-
191
-
192
-
193
-
194
-
195
-
196
-
197
-
198
-
199
-
 200
200 -
 201
201 -
 202
202 -
 203
203 -
 204
204 -
 205
205 -
 206
206 -
 207
207 -
 208
208 -
 209
209 -
 210
210 -
 211
211 -
 212
212 -
 213
213 -
 214
214 -
 215
215 -
 216
216 -
 217
217 -
 218
218 -
 219
219 -
 220
220 -
221
-
222
-
223
-
224
-
225
-
226
-
227
-
228
-
229
-
230
-
231
-
232
-
233
-
234
-
235
-
236
-
237
-
238
-
239
-
240
-
241
-
242
-
243
-
244
-
245
-
246
-
247
-
248
 |
 |

THE HARTFORD FINANCIAL SERVICES GROUP, INC.
NOTES TO CONSOLIDATED FINANCIAL STATEMENTS (continued)
F-82
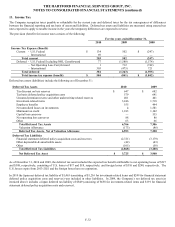
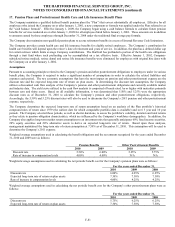
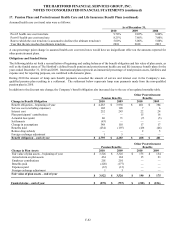
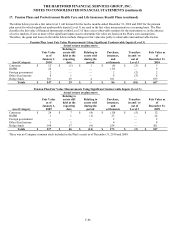
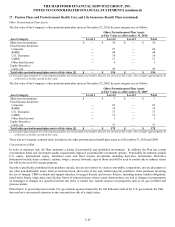
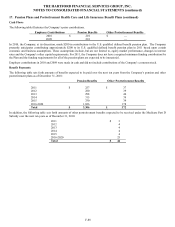
17. Pension Plans and Postretirement Health Care and Life Insurance Benefit Plans (continued)
Assumed health care cost trend rates were as follows:
As of December 31,
2010 2009 2008
Pre-65 health care cost trend rate 9.70% 9.05% 8.80%
Post-65 health care cost trend rate 8.25% 7.60% 7.00%
Rate to which the cost trend rate is assumed to decline (the ultimate trend rate) 5.00% 5.00% 5.00%
Year that the rate reaches the ultimate trend rate 2018 2018 2015
A one-percentage point change in assumed health care cost trend rates would have an insignificant effect on the amounts reported for
other postretirement plans.
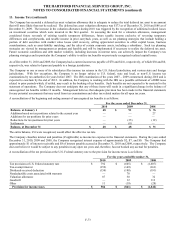
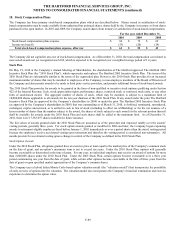
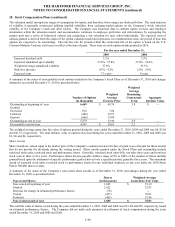
Obligations and Funded Status
The following tables set forth a reconciliation of beginning and ending balances of the benefit obligation and fair value of plan assets, as
well as the funded status of The Hartford’ s defined benefit pension and postretirement health care and life insurance benefit plans for the
years ended December 31, 2010 and 2009. International plans represent an immaterial percentage of total pension assets, liabilities and
expense and, for reporting purposes, are combined with domestic plans.
During 2010 the amount of lump sum benefit payments exceeded the amount of service and interest cost in the Company’ s non-
qualified pension plan resulting in a settlement. The settlement below represents lump sum payments made from the non-qualified
pension plan in 2010.
In addition to the discount rate change, the Company’ s benefit obligation also increased due to the use of an updated mortality table.
Pension Benefits
Other Postretirement
Benefits
Change in Benefit Obligation 2010 2009 2010 2009
Benefit obligation – beginning of year $4,283 $ 3,938 $ 401 $ 384
Service cost (excluding expenses) 102 105 7 6
Interest cost 252 243 22 24
Plan participants’ contributions — — 15 16
Actuarial loss (gain) 86 71 (7) (5)
Settlements (43) — — —
Change in assumptions 348 118 17 17
Benefits paid (234) (197) (49) (46)
Retiree drug subsidy — — 2 5
Foreign exchange adjustment 1 5 — —
Benefit obligation – end of year $4,795 $ 4,283 $ 408 $ 401
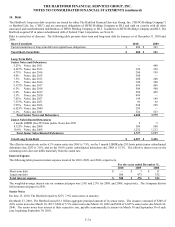
Pension Benefits
Other Postretirement
Benefits
Change in Plan Assets 2010 2009 2010 2009
Fair value of plan assets – beginning of year $ 3,526 $ 3,326 $ 175 $ 154
Actual return on plan assets 434 184 15 21
Employer contributions 201 201 — —
Benefits paid (228) (177) — —
Expenses paid (12) (13) — —
Foreign exchange adjustment 1 5 — —
Fair value of plan assets – end of year $ 3,922 $ 3,526 $ 190 $ 175
Funded status – end of year $(873) $ (757) $ (218) $ (226)