Rosetta Stone 2012 Annual Report Download - page 84
Download and view the complete annual report
Please find page 84 of the 2012 Rosetta Stone annual report below. You can navigate through the pages in the report by either clicking on the pages listed below, or by using the keyword search tool below to find specific information within the annual report.-
 1
1 -
2
-
3
-
4
-
5
-
6
-
7
-
8
-
9
-
10
-
11
-
12
-
13
-
14
-
15
-
16
-
17
-
18
-
19
-
20
-
21
-
22
-
23
-
24
-
25
-
26
-
27
-
28
-
29
-
30
-
31
-
32
-
33
-
34
-
35
-
36
-
37
-
38
-
39
-
40
-
41
-
42
-
43
-
44
-
45
-
46
-
47
-
48
-
49
-
50
-
51
-
52
-
53
-
54
-
55
-
56
-
57
-
58
-
59
-
60
-
61
-
62
-
63
-
64
-
65
-
66
-
67
-
68
-
69
-
70
-
71
-
72
-
73
-
 74
74 -
 75
75 -
 76
76 -
 77
77 -
 78
78 -
 79
79 -
 80
80 -
 81
81 -
 82
82 -
 83
83 -
 84
84 -
 85
85 -
 86
86 -
 87
87 -
 88
88 -
 89
89 -
 90
90 -
 91
91 -
 92
92 -
 93
93 -
 94
94 -
95
-
96
-
97
-
98
-
99
-
100
-
101
-
102
-
103
-
104
-
105
-
106
-
107
-
108
-
109
-
110
-
111
-
112
-
113
-
114
-
115
-
116
-
117
-
118
-
119
-
120
-
121
-
122
-
123
-
124
-
125
-
126
-
127
-
128
-
129
-
130
-
131
-
132
-
133
-
134
-
135
-
136
-
137
-
138
-
139
-
140
-
141
-
142
-
143
-
144
-
145
-
146
-
147
-
148
-
149
-
150
-
151
-
152
-
153
-
154
-
155
 |
 |

Table of Contents
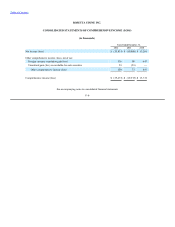
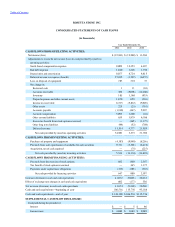
Net income (loss) $ (35,831) $ (19,988) $ 13,284
Adjustments to reconcile net income (loss) to cash provided by (used in)
operating activities:
Stock-based compensation expense 8,009 12,353 4,387
Bad debt expense 1,820 1,228 1,750
Depreciation and amortization 8,077 8,724 6,615
Deferred income tax expense (benefit) 27,035 (1,297) (6,057)
Loss on disposal of equipment 783 318 37
Net change in:
Restricted cash 1 11 (30)
Accounts receivable 309 (5,058) (12,260)
Inventory 185 3,168 (935)
Prepaid expenses and other current assets 1,870 659 (236)
Income tax receivable 6,515 (5,812) (5,028)
Other assets 225 (25) (761)
Accounts payable (1,240) (447) 5,987
Accrued compensation 5,093 1,200 (16)
Other current liabilities 635 3,979 6,106
Excess tax benefit from stock options exercised — (365) (1,377)
Other long term liabilities (99) (52) (789)
Deferred revenue 11,514 4,777 21,029
Net cash provided by (used in) operating activities 34,901 3,373 31,706
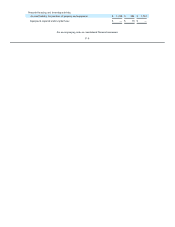
Purchases of property and equipment (4,187) (9,940) (8,256)
Proceeds from sales (purchases) of available-for-sale securities 9,711 (3,301) (6,410)
Acquisition, net of cash acquired — (75) (225)
Net cash provided by (used in) investing activities 5,524 (13,316) (14,891)
Proceeds from the exercise of stock options 862 800 2,387
Tax benefit of stock options exercised — 365 1,377
Payments under capital lease obligations (215) (285) (367)
Net cash provided by financing activities 647 880 3,397
Increase (decrease) in cash and cash equivalents 41,072 (9,063) 20,212
Effect of exchange rate changes in cash and cash equivalents 602 (177) 356
Net increase (decrease) in cash and cash equivalents 41,674 (9,240) 20,568
Cash and cash equivalents—beginning of year 106,516 115,756 95,188
Cash and cash equivalents—end of year $ 148,190 $ 106,516 $ 115,756
Cash paid during the periods for:
Interest $ — $ 5 $ 66
Income taxes $ 4,040 $ 1,683 $ 9,989