Rosetta Stone 2012 Annual Report Download - page 64
Download and view the complete annual report
Please find page 64 of the 2012 Rosetta Stone annual report below. You can navigate through the pages in the report by either clicking on the pages listed below, or by using the keyword search tool below to find specific information within the annual report.-
 1
1 -
2
-
3
-
4
-
5
-
6
-
7
-
8
-
9
-
10
-
11
-
12
-
13
-
14
-
15
-
16
-
17
-
18
-
19
-
20
-
21
-
22
-
23
-
24
-
25
-
26
-
27
-
28
-
29
-
30
-
31
-
32
-
33
-
34
-
35
-
36
-
37
-
38
-
39
-
40
-
41
-
42
-
43
-
44
-
45
-
46
-
47
-
48
-
49
-
50
-
51
-
52
-
53
-
 54
54 -
 55
55 -
 56
56 -
 57
57 -
 58
58 -
 59
59 -
 60
60 -
 61
61 -
 62
62 -
 63
63 -
 64
64 -
 65
65 -
 66
66 -
 67
67 -
 68
68 -
 69
69 -
 70
70 -
 71
71 -
 72
72 -
 73
73 -
 74
74 -
75
-
76
-
77
-
78
-
79
-
80
-
81
-
82
-
83
-
84
-
85
-
86
-
87
-
88
-
89
-
90
-
91
-
92
-
93
-
94
-
95
-
96
-
97
-
98
-
99
-
100
-
101
-
102
-
103
-
104
-
105
-
106
-
107
-
108
-
109
-
110
-
111
-
112
-
113
-
114
-
115
-
116
-
117
-
118
-
119
-
120
-
121
-
122
-
123
-
124
-
125
-
126
-
127
-
128
-
129
-
130
-
131
-
132
-
133
-
134
-
135
-
136
-
137
-
138
-
139
-
140
-
141
-
142
-
143
-
144
-
145
-
146
-
147
-
148
-
149
-
150
-
151
-
152
-
153
-
154
-
155
 |
 |

Table of Contents
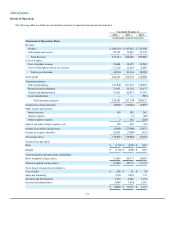
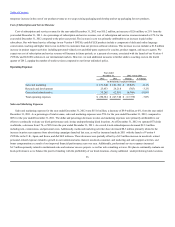
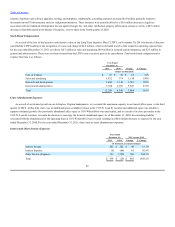
Sales and marketing expenses for the year ended December 31, 2011 were $161.5 million, an increase of $30.6 million, or 23%, from the year
ended December 31, 2010. As a percentage of total revenue, sales and marketing expenses were 60% for the year ended December 31, 2011, compared
to 51% for the year ended December 31, 2010. The dollar and percentage increase in sales and marketing expenses were primarily attributable to the
continued expansion of our direct marketing activities in the U.S. and international markets. Media and marketing activities grew by $20.2 million,
primarily outside of the U.S., including the launch of our new advertising campaign focused on promoting language learning and our brand, increased
media associated with the launch of Version 4 in the United Kingdom, Japan and Korea as well as in Korea, and increased internet
marketing due to increased spending in online social media networks. Professional services increased by $4.7 million over the prior year period as a
result of increased consulting related to international brand strategy, segmentation study and market research conducted in 2011, as well as clerical
service expenses related to institutional and international retail sales. Personnel-related costs as a result of growth in our institutional sales channel, non-
kiosk consumer, and marketing and sales support activities increased by $6.0 million over the prior year period of which, $0.8 million related to the
addition of the Long Term Incentive Program, or LTIP, which was subsequently cancelled late in 2011. Additionally, travel and training expense
increased by $0.5 million over the prior year period as a result of increased travel in our institutional sales channel and global initiatives, commissions
increased by $0.7 million as a result of increased institutional and international consumer revenue, $0.5 million increase in depreciation and amortization
due to increased capitalized software costs in 2011, $1.0 million increase in IT related product development and improvement projects, $0.6 million in
recruitment expenses due to our entry into new international markets, as well as $0.3 million increase in trade shows driven by Korea and U.S. These
costs were partially offset by a decrease of $4.4 million in kiosk related expenses as the number of worldwide kiosks decreased from 259 as of
December 31, 2010 to 174 as of December 31, 2011.
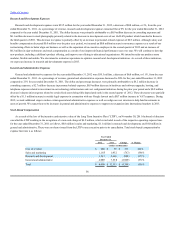
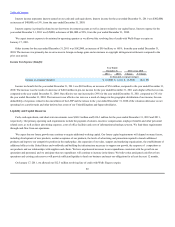
Research and development expenses were $24.2 million for the year ended December 31, 2011, an increase of $0.8 million, or 3%, from the year
ended December 31, 2010. As a percentage of revenue, research and development expenses remained flat at 9% for the years ended December 31, 2011
and 2010. The dollar increases were primarily attributable to personnel-related increases in development personnel of $2.9 million of which,
$1.1 million related to the addition of the LTIP compensation program which was subsequently cancelled in the fourth quarter of 2011. This increase in
personnel costs was partially offset by a $1.3 million decrease in consulting-related costs, $0.3 million decrease in travel expenses, and $0.3 million
decrease in hardware and software expenses related to the increased costs in 2010 associated with the development of new products and services as we
launched our new Version 4 product in the fourth quarter of 2010. Additionally, communications expenses decrease $0.2 million as a result of
decreased hosting expenses.
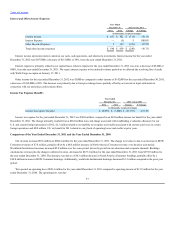
General and administrative expenses for the year ended December 31, 2011 were $62.0 million, an increase of $8.8 million, or 17%, from the year
ended December 31, 2010. As a percentage of revenue, general and administrative expenses increased to 23% for the year ended December 31, 2011
compared to 21% for the year ended December 31, 2010. The dollar and percentage increases were primarily attributable to an $8.5 million increase in
personnel-related costs of which $4.0 million related to the addition of the LTIP compensation program which was subsequently cancelled in the fourth
quarter of 2011. The remaining increase in personnel-related costs related to severance expenses due to company restructuring, executive compensation
and recruiting costs related to our search for a new chief executive officer, and international expansion. IT and infrastructure expenses increased
$3.0 million
61