Rosetta Stone 2012 Annual Report Download - page 80
Download and view the complete annual report
Please find page 80 of the 2012 Rosetta Stone annual report below. You can navigate through the pages in the report by either clicking on the pages listed below, or by using the keyword search tool below to find specific information within the annual report.-
 1
1 -
2
-
3
-
4
-
5
-
6
-
7
-
8
-
9
-
10
-
11
-
12
-
13
-
14
-
15
-
16
-
17
-
18
-
19
-
20
-
21
-
22
-
23
-
24
-
25
-
26
-
27
-
28
-
29
-
30
-
31
-
32
-
33
-
34
-
35
-
36
-
37
-
38
-
39
-
40
-
41
-
42
-
43
-
44
-
45
-
46
-
47
-
48
-
49
-
50
-
51
-
52
-
53
-
54
-
55
-
56
-
57
-
58
-
59
-
60
-
61
-
62
-
63
-
64
-
65
-
66
-
67
-
68
-
69
-
 70
70 -
 71
71 -
 72
72 -
 73
73 -
 74
74 -
 75
75 -
 76
76 -
 77
77 -
 78
78 -
 79
79 -
 80
80 -
 81
81 -
 82
82 -
 83
83 -
 84
84 -
 85
85 -
 86
86 -
 87
87 -
 88
88 -
 89
89 -
 90
90 -
91
-
92
-
93
-
94
-
95
-
96
-
97
-
98
-
99
-
100
-
101
-
102
-
103
-
104
-
105
-
106
-
107
-
108
-
109
-
110
-
111
-
112
-
113
-
114
-
115
-
116
-
117
-
118
-
119
-
120
-
121
-
122
-
123
-
124
-
125
-
126
-
127
-
128
-
129
-
130
-
131
-
132
-
133
-
134
-
135
-
136
-
137
-
138
-
139
-
140
-
141
-
142
-
143
-
144
-
145
-
146
-
147
-
148
-
149
-
150
-
151
-
152
-
153
-
154
-
155
 |
 |

Table of Contents
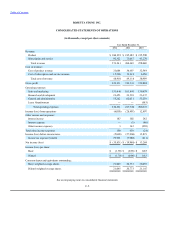
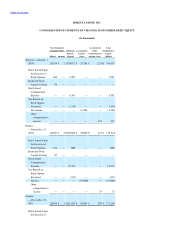
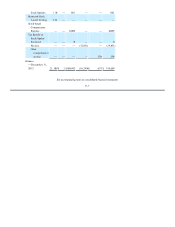
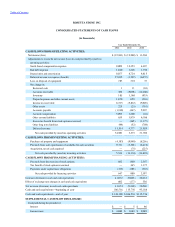
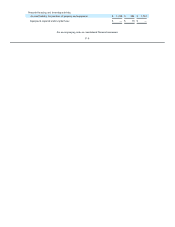
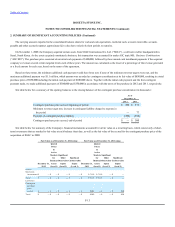
See accompanying notes to consolidated financial statements
F-5
Revenue:
Product $ 180,919 $ 195,382 $ 215,590
Subscription and service 92,322 73,067 43,278
Total revenue 273,241 268,449 258,868
Cost of revenue:
Cost of product revenue 33,684 36,497 32,549
Cost of subscription and service revenue 15,226 12,619 6,450
Total cost of revenue 48,910 49,116 38,999
Gross profit 224,331 219,333 219,869
Operating expenses
Sales and marketing 151,646 161,491 130,879
Research and development 23,453 24,218 23,437
General and administrative 55,262 62,031 53,239
Lease Abandonment — — (583)
Total operating expenses 230,361 247,740 206,972
Income (loss) from operations (6,030) (28,407) 12,897
Other income and (expense):
Interest income 187 302 262
Interest expense — (5) (66)
Other income (expense) 3 142 (220)
Total other income (expense) 190 439 (24)
Income (loss) before income taxes (5,840) (27,968) 12,873
Income tax expense (benefit) 29,991 (7,980) (411)
Net income (loss) $ (35,831) $ (19,988) $ 13,284
Income (loss) per share:
Basic $ (1.70) $ (0.96) $ 0.65
Diluted $ (1.70) $ (0.96) $ 0.63
Common shares and equivalents outstanding:
Basic weighted average shares 21,045 20,773 20,439
Diluted weighted average shares 21,045 20,773 21,187