Rosetta Stone 2012 Annual Report Download - page 49
Download and view the complete annual report
Please find page 49 of the 2012 Rosetta Stone annual report below. You can navigate through the pages in the report by either clicking on the pages listed below, or by using the keyword search tool below to find specific information within the annual report.-
 1
1 -
2
-
3
-
4
-
5
-
6
-
7
-
8
-
9
-
10
-
11
-
12
-
13
-
14
-
15
-
16
-
17
-
18
-
19
-
20
-
21
-
22
-
23
-
24
-
25
-
26
-
27
-
28
-
29
-
30
-
31
-
32
-
33
-
34
-
35
-
36
-
37
-
38
-
 39
39 -
 40
40 -
 41
41 -
 42
42 -
 43
43 -
 44
44 -
 45
45 -
 46
46 -
 47
47 -
 48
48 -
 49
49 -
 50
50 -
 51
51 -
 52
52 -
 53
53 -
 54
54 -
 55
55 -
 56
56 -
 57
57 -
 58
58 -
 59
59 -
60
-
61
-
62
-
63
-
64
-
65
-
66
-
67
-
68
-
69
-
70
-
71
-
72
-
73
-
74
-
75
-
76
-
77
-
78
-
79
-
80
-
81
-
82
-
83
-
84
-
85
-
86
-
87
-
88
-
89
-
90
-
91
-
92
-
93
-
94
-
95
-
96
-
97
-
98
-
99
-
100
-
101
-
102
-
103
-
104
-
105
-
106
-
107
-
108
-
109
-
110
-
111
-
112
-
113
-
114
-
115
-
116
-
117
-
118
-
119
-
120
-
121
-
122
-
123
-
124
-
125
-
126
-
127
-
128
-
129
-
130
-
131
-
132
-
133
-
134
-
135
-
136
-
137
-
138
-
139
-
140
-
141
-
142
-
143
-
144
-
145
-
146
-
147
-
148
-
149
-
150
-
151
-
152
-
153
-
154
-
155
 |
 |

Table of Contents
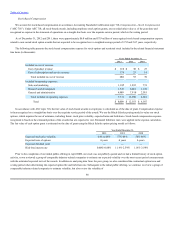
We account for stock-based compensation in accordance Accounting Standards Codification topic 718,
("ASC 718"). Under ASC 718, all stock-based awards, including employee stock option grants, are recorded at fair value as of the grant date and
recognized as expense in the statement of operations on a straight-line basis over the requisite service period, which is the vesting period.
As of December 31, 2012 and 2011, there were approximately $6.8 million and $7.9 million of unrecognized stock-based compensation expense
related to non-vested stock option awards that are expected to be recognized over a weighted average period of 2.52 and 2.67 years, respectively.
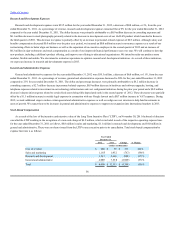
The following table presents the stock-based compensation expense for stock options and restricted stock included in the related financial statement
line items (in thousands):
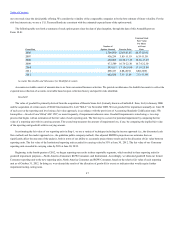
In accordance with ASC topic 718, the fair value of stock-based awards to employees is calculated as of the date of grant. Compensation expense
is then recognized on a straight-line basis over the requisite service period of the award. We use the Black-Scholes pricing model to value our stock
options, which requires the use of estimates, including future stock price volatility, expected term and forfeitures. Stock-based compensation expense
recognized is based on the estimated portion of the awards that are expected to vest. Estimated forfeiture rates were applied in the expense calculation.
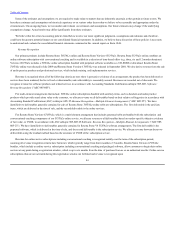
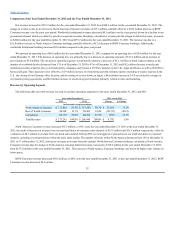
The fair value of each option grant is estimated on the date of grant using the Black Scholes option pricing model as follows:
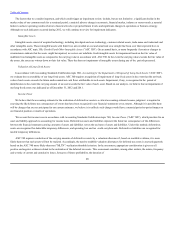
Prior to the completion of our initial public offering in April 2009, our stock was not publicly quoted and we had a limited history of stock option
activity, so we reviewed a group of comparable industry-related companies to estimate our expected volatility over the most recent period commensurate
with the estimated expected term of the awards. In addition to analyzing data from the peer group, we also considered the contractual option term and
vesting period when determining the expected option life and forfeiture rate. Subsequent to the initial public offering, we continue to review a group of
comparable industry-related companies to estimate volatility, but also review the volatility of
46
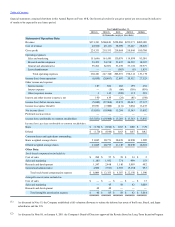
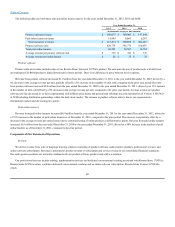
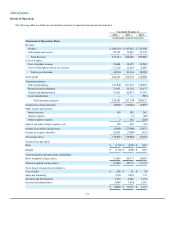
Included in cost of revenue:
Cost of product revenue $ 110 $ 30 $ 25
Cost of subscription and service revenue 178 25 14
Total included in cost of revenue 288 55 39
Included in operating expenses:
Sales and marketing 1,185 1,932 774
Research and development 1,547 2,448 1,181
General and administrative 4,989 7,918 2,393
Total included in operating expenses 7,721 12,298 4,348
Total $ 8,009 $ 12,353 $ 4,387
Expected stock price volatility 64% to 66% 57%-64% 58%-66%
Expected term of options 6 years 6 years 6 years
Expected dividend yield — — —
Risk-free interest rate 0.60%-0.88% 1.14%-2.59% 1.14%-2.59%