Rosetta Stone 2012 Annual Report Download - page 58
Download and view the complete annual report
Please find page 58 of the 2012 Rosetta Stone annual report below. You can navigate through the pages in the report by either clicking on the pages listed below, or by using the keyword search tool below to find specific information within the annual report.-
 1
1 -
2
-
3
-
4
-
5
-
6
-
7
-
8
-
9
-
10
-
11
-
12
-
13
-
14
-
15
-
16
-
17
-
18
-
19
-
20
-
21
-
22
-
23
-
24
-
25
-
26
-
27
-
28
-
29
-
30
-
31
-
32
-
33
-
34
-
35
-
36
-
37
-
38
-
39
-
40
-
41
-
42
-
43
-
44
-
45
-
46
-
47
-
 48
48 -
 49
49 -
 50
50 -
 51
51 -
 52
52 -
 53
53 -
 54
54 -
 55
55 -
 56
56 -
 57
57 -
 58
58 -
 59
59 -
 60
60 -
 61
61 -
 62
62 -
 63
63 -
 64
64 -
 65
65 -
 66
66 -
 67
67 -
 68
68 -
69
-
70
-
71
-
72
-
73
-
74
-
75
-
76
-
77
-
78
-
79
-
80
-
81
-
82
-
83
-
84
-
85
-
86
-
87
-
88
-
89
-
90
-
91
-
92
-
93
-
94
-
95
-
96
-
97
-
98
-
99
-
100
-
101
-
102
-
103
-
104
-
105
-
106
-
107
-
108
-
109
-
110
-
111
-
112
-
113
-
114
-
115
-
116
-
117
-
118
-
119
-
120
-
121
-
122
-
123
-
124
-
125
-
126
-
127
-
128
-
129
-
130
-
131
-
132
-
133
-
134
-
135
-
136
-
137
-
138
-
139
-
140
-
141
-
142
-
143
-
144
-
145
-
146
-
147
-
148
-
149
-
150
-
151
-
152
-
153
-
154
-
155
 |
 |

Table of Contents
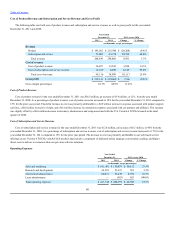
temporary increase in the cost of our product revenue as we scrap existing packaging and develop and set up packaging for new products.
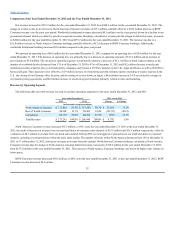
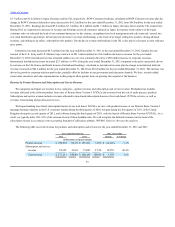
Cost of subscription and service revenue for the year ended December 31, 2012 was $15.2 million, an increase of $2.6 million, or 21% from the
year ended December 31, 2011. As a percentage of subscription and service revenue, cost of subscription and service revenue remained at 17% for the
year ended December 31, 2012 compared to the prior year period. The increase in cost was primarily attributable to an increase in paid online
subscribers. Our web-based service offerings in our Version 4 and products include a component of dedicated online language
conversation coaching and higher direct costs to deliver to customers than our previous software solutions. This increase in costs includes a $1.8 million
increase in product support activities including personnel-related costs and third-party expenses for coaches, product support, and success agents. We
expect our cost of subscription and service revenue will increase in future periods, as a percent of revenue, associated with the launch of our Version 4
and solutions in our international markets. However, we took additional measures to further address coaching costs in the fourth
quarter of 2012, capping the number of studio sessions compared to our former unlimited policy.
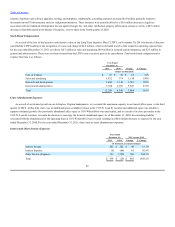
Sales and marketing expenses for the year ended December 31, 2012 were $151.6 million, a decrease of $9.9 million, or 6%, from the year ended
December 31, 2011. As a percentage of total revenue, sales and marketing expenses were 55% for the year ended December 31, 2012, compared to
60% for the year ended December 31, 2011. The dollar and percentage decreases in sales and marketing expenses were primarily attributable to our
efforts to continually evaluate our kiosk performance and closing underperforming kiosk locations. As of December 31, 2012 we operated 87 kiosks
worldwide, a decrease from 174, or 50% from the year ended December 31, 2011. As a result, kiosk-related expenses decreased $12.3 million
including rent, commissions, and personnel costs. Additionally, media and marketing activities have decreased $8.3 million primarily related to the
increase in prior year expenses from advertising campaigns launched last year, as well as increased media in 2011 with the launch of Version 4
in the U.K., Japan, and Korea, and in Korea. These decreases were partially offset by a $4.5 million increase in non-kiosk related
personnel-related expenses related to growth in our institutional sales channel, non-kiosk consumer, and marketing and sales support activities, and
bonus compensation as a result of our improved financial performance year over year. Additionally, professional services expenses increased
$4.7 million primarily related to institutional sales and customer success projects as well as web consulting services. We plan to continually evaluate our
kiosk performance as we balance the positive branding with the profitability of our kiosk locations, closing additional underperforming kiosk locations.
55
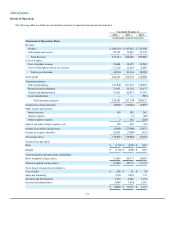
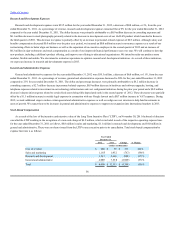
Sales and marketing $ 151,646 $ 161,491 $ (9,845) -6.1%
Research and development 23,453 24,218 (765) -3.2%
General and administrative 55,262 62,031 (6,769) -10.9%
Total operating expenses $ 230,361 $ 247,740 $ (17,379) -7.0%