Rosetta Stone 2012 Annual Report Download - page 55
Download and view the complete annual report
Please find page 55 of the 2012 Rosetta Stone annual report below. You can navigate through the pages in the report by either clicking on the pages listed below, or by using the keyword search tool below to find specific information within the annual report.-
 1
1 -
2
-
3
-
4
-
5
-
6
-
7
-
8
-
9
-
10
-
11
-
12
-
13
-
14
-
15
-
16
-
17
-
18
-
19
-
20
-
21
-
22
-
23
-
24
-
25
-
26
-
27
-
28
-
29
-
30
-
31
-
32
-
33
-
34
-
35
-
36
-
37
-
38
-
39
-
40
-
41
-
42
-
43
-
44
-
 45
45 -
 46
46 -
 47
47 -
 48
48 -
 49
49 -
 50
50 -
 51
51 -
 52
52 -
 53
53 -
 54
54 -
 55
55 -
 56
56 -
 57
57 -
 58
58 -
 59
59 -
 60
60 -
 61
61 -
 62
62 -
 63
63 -
 64
64 -
 65
65 -
66
-
67
-
68
-
69
-
70
-
71
-
72
-
73
-
74
-
75
-
76
-
77
-
78
-
79
-
80
-
81
-
82
-
83
-
84
-
85
-
86
-
87
-
88
-
89
-
90
-
91
-
92
-
93
-
94
-
95
-
96
-
97
-
98
-
99
-
100
-
101
-
102
-
103
-
104
-
105
-
106
-
107
-
108
-
109
-
110
-
111
-
112
-
113
-
114
-
115
-
116
-
117
-
118
-
119
-
120
-
121
-
122
-
123
-
124
-
125
-
126
-
127
-
128
-
129
-
130
-
131
-
132
-
133
-
134
-
135
-
136
-
137
-
138
-
139
-
140
-
141
-
142
-
143
-
144
-
145
-
146
-
147
-
148
-
149
-
150
-
151
-
152
-
153
-
154
-
155
 |
 |

Table of Contents
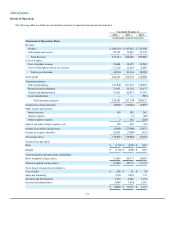
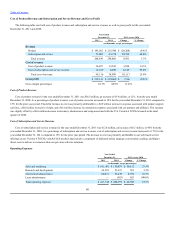
Our revenue increased to $273.2 million for the year ended December 31, 2012 from $268.4 million for the year ended December 31, 2011. The
change in revenue is due to an increase in North American Consumer revenues of $15.3 million, partially offset by a $10.2 million decrease in ROW
Consumer revenue, over the prior year period. Worldwide Institutional revenues decreased $0.3 million over the same period, driven by a decline in our
government channel which was offset by growth in corporate revenues. Bookings, calculated as revenue plus the change in deferred revenue, increased
to $284.8 million for the year ended December 31, 2012 from $273.2 million for the year ended December 31, 2011. The increase was due to a
$21.8 million increase in North America Consumer bookings, partially offset by a $12.8 decrease in ROW Consumer bookings. Additionally,
worldwide Institutional bookings increased $2.6 million compared to the prior year period.
We reported an operating loss of $6.0 million for the year ended December 31, 2012 compared to an operating loss of $28.4 million for the year
ended December 31, 2011. The decrease in operating loss was primarily due to a decrease in operating expenses of $17.4 million and an increase in
gross margin of $5.0 million. The decrease in operating expenses was primarily related to a decrease of $12.3 million in kiosk related expenses as the
number of worldwide kiosks decreased from 174 as of December 31, 2011 to 87 as of December 31, 2012 and $8.2 million decrease in media and
marketing activities related to prior year brand identity campaigns and Version 4 launches in the U.K., Japan and Korea, as well as in
Korea and Japan. These decreases were offset by a $1.9 million increase in restructuring and other related expenses including severance expense in the
U.S., the closing of our Germany office location, and the closing of several kiosks in Japan, a $0.6 million increase in VAT tax related to a change in
our transfer pricing agreements, and $0.6 million increase in non-kiosk payroll expenses primarily related to sales and marketing.
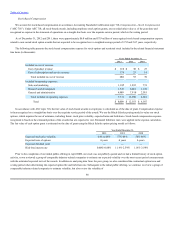
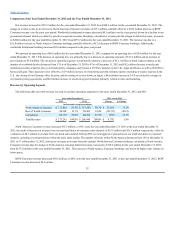
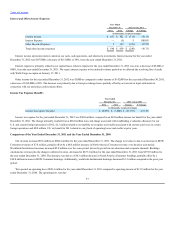
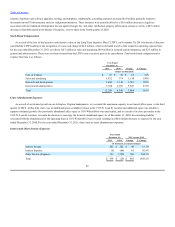
The following table sets forth revenue for each of our three operating segments for the years ended December 31, 2012 and 2011:
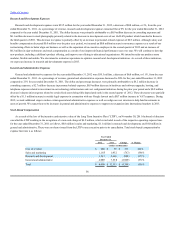
North America Consumer revenue increased $15.3 million, or 10%, from the year ended December 31, 2011 to the year ended December 31,
2012, the result of increases in revenue from our retail and direct-to-consumer sales channels of $12.5 million and $11.4 million, respectively, offset by
a reduction of $8.7 million in revenue from our kiosk sales channel. During 2012 we used aggressive promotions in our retail and direct-to-consumer
channels, including several promotions within the daily deals market. The number of kiosks within North America decreased from 103 at December 31,
2011 to 57 at December 31, 2012, driving the decrease in revenue from this channel. North America Consumer bookings, calculated as North America
Consumer revenue plus the change in North America consumer deferred revenue, increased to $179.2 million for the year ended December 31, 2012
from $157.4 million for the year ended December 31, 2011. The increase in North America Consumer bookings was driven by higher sales volume on
lower prices.
ROW Consumer revenue decreased $10.2 million, or 20%, from the year ended December 31, 2011 to the year ended December 31, 2012. ROW
Consumer revenue decreased $4.2 million,
52
North America Consumer $ 172,826 63.3% $ 157,562 58.7% $ 15,264 9.7%
Rest of World Consumer 40,248 14.7% 50,465 18.8% (10,217) -20.2%
Institutional 60,167 22.0% 60,422 22.5% (255) -0.4%
Total Revenue $ 273,241 100.0% $ 268,449 100.0% $ 4,792 1.8%