Rosetta Stone 2012 Annual Report Download - page 37
Download and view the complete annual report
Please find page 37 of the 2012 Rosetta Stone annual report below. You can navigate through the pages in the report by either clicking on the pages listed below, or by using the keyword search tool below to find specific information within the annual report.-
 1
1 -
2
-
3
-
4
-
5
-
6
-
7
-
8
-
9
-
10
-
11
-
12
-
13
-
14
-
15
-
16
-
17
-
18
-
19
-
20
-
21
-
22
-
23
-
24
-
25
-
26
-
 27
27 -
 28
28 -
 29
29 -
 30
30 -
 31
31 -
 32
32 -
 33
33 -
 34
34 -
 35
35 -
 36
36 -
 37
37 -
 38
38 -
 39
39 -
 40
40 -
 41
41 -
 42
42 -
 43
43 -
 44
44 -
 45
45 -
 46
46 -
 47
47 -
48
-
49
-
50
-
51
-
52
-
53
-
54
-
55
-
56
-
57
-
58
-
59
-
60
-
61
-
62
-
63
-
64
-
65
-
66
-
67
-
68
-
69
-
70
-
71
-
72
-
73
-
74
-
75
-
76
-
77
-
78
-
79
-
80
-
81
-
82
-
83
-
84
-
85
-
86
-
87
-
88
-
89
-
90
-
91
-
92
-
93
-
94
-
95
-
96
-
97
-
98
-
99
-
100
-
101
-
102
-
103
-
104
-
105
-
106
-
107
-
108
-
109
-
110
-
111
-
112
-
113
-
114
-
115
-
116
-
117
-
118
-
119
-
120
-
121
-
122
-
123
-
124
-
125
-
126
-
127
-
128
-
129
-
130
-
131
-
132
-
133
-
134
-
135
-
136
-
137
-
138
-
139
-
140
-
141
-
142
-
143
-
144
-
145
-
146
-
147
-
148
-
149
-
150
-
151
-
152
-
153
-
154
-
155
 |
 |

Table of Contents
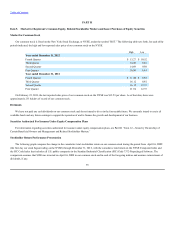
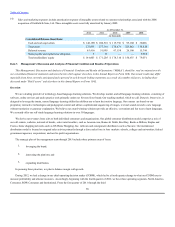
Our common stock is listed on the New York Stock Exchange, or NYSE, under the symbol "RST." The following table sets forth, for each of the
periods indicated, the high and low reported sales price of our common stock on the NYSE.
On February 22, 2013, the last reported sales price of our common stock on the NYSE was $12.53 per share. As of that date, there were
approximately 233 holders of record of our common stock.
We have not paid any cash dividends on our common stock and do not intend to do so in the foreseeable future. We currently intend to retain all
available funds and any future earnings to support the operation of and to finance the growth and development of our business.
For information regarding securities authorized for issuance under equity compensation plans, see Part III "Item 12—Security Ownership of
Certain Beneficial Owners and Management and Related Stockholder Matters."
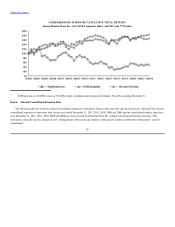
The following graph compares the change in the cumulative total stockholder return on our common stock during the period from April 16, 2009
(the first day our stock began trading on the NYSE) through December 31, 2012, with the cumulative total return on the NYSE Composite Index and
the SIC Code Index that includes all U.S. public companies in the Standard Industrial Classification (SIC) Code 7372-Prepackaged Software. The
comparison assumes that $100 was invested on April 16, 2009 in our common stock and in each of the foregoing indices and assumes reinvestment of
dividends, if any.
35
Fourth Quarter $ 13.27 $ 10.52
Third Quarter 14.28 9.26
Second Quarter 14.69 9.50
First Quarter 10.50 6.95
Fourth Quarter $ 11.00 $ 6.55
Third Quarter 16.12 8.92
Second Quarter 16.15 12.57
First Quarter 21.94 12.57