Rosetta Stone 2012 Annual Report Download - page 60
Download and view the complete annual report
Please find page 60 of the 2012 Rosetta Stone annual report below. You can navigate through the pages in the report by either clicking on the pages listed below, or by using the keyword search tool below to find specific information within the annual report.-
 1
1 -
2
-
3
-
4
-
5
-
6
-
7
-
8
-
9
-
10
-
11
-
12
-
13
-
14
-
15
-
16
-
17
-
18
-
19
-
20
-
21
-
22
-
23
-
24
-
25
-
26
-
27
-
28
-
29
-
30
-
31
-
32
-
33
-
34
-
35
-
36
-
37
-
38
-
39
-
40
-
41
-
42
-
43
-
44
-
45
-
46
-
47
-
48
-
49
-
 50
50 -
 51
51 -
 52
52 -
 53
53 -
 54
54 -
 55
55 -
 56
56 -
 57
57 -
 58
58 -
 59
59 -
 60
60 -
 61
61 -
 62
62 -
 63
63 -
 64
64 -
 65
65 -
 66
66 -
 67
67 -
 68
68 -
 69
69 -
 70
70 -
71
-
72
-
73
-
74
-
75
-
76
-
77
-
78
-
79
-
80
-
81
-
82
-
83
-
84
-
85
-
86
-
87
-
88
-
89
-
90
-
91
-
92
-
93
-
94
-
95
-
96
-
97
-
98
-
99
-
100
-
101
-
102
-
103
-
104
-
105
-
106
-
107
-
108
-
109
-
110
-
111
-
112
-
113
-
114
-
115
-
116
-
117
-
118
-
119
-
120
-
121
-
122
-
123
-
124
-
125
-
126
-
127
-
128
-
129
-
130
-
131
-
132
-
133
-
134
-
135
-
136
-
137
-
138
-
139
-
140
-
141
-
142
-
143
-
144
-
145
-
146
-
147
-
148
-
149
-
150
-
151
-
152
-
153
-
154
-
155
 |
 |

Table of Contents
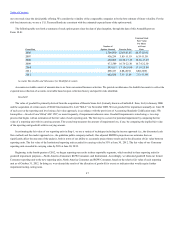
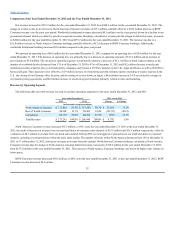
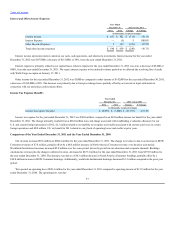
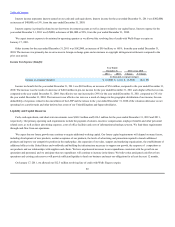
Interest income represents interest earned on our cash, cash equivalents, and short-term investments. Interest income for the year ended
December 31, 2012 was $187,000, a decrease of $115,000, or 38%, from the year ended December 31, 2011.
Interest expense is primarily related to our capital leases. Interest expense for the year ended December 31, 2012 was zero, a decrease of $5,000 or
100%, from the year ended December 31, 2011. We expect interest expense to be minimal in future periods as we allowed the revolving line of credit
with Wells Fargo to expire on January 17, 2011.
Other income for the year ended December 31, 2012 was $3,000 as compared to other income of $142,000 for the year ended December 30, 2011,
a decrease of $139,000 or 98%. The decrease was primarily due to foreign exchange losses partially offset by an increase in legal settlements in
connection with our anti-piracy enforcement efforts.
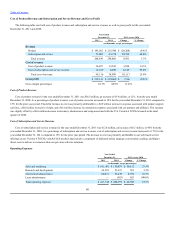
Income tax expense for the year ended December 31, 2012 was $30.0 million, compared to an $8.0 million income tax benefit for the year ended
December 31, 2011. The change primarily resulted from a $26.0 million non-cash charge associated with establishing a valuation allowance for our
U.S. and certain foreign operations in 2012, $2.3 million related to our inability to recognize tax benefits associated with current year losses in certain
foreign operations and $9.0 million U.S. tax benefit in 2011 related to carry back of operating losses and credits to prior years
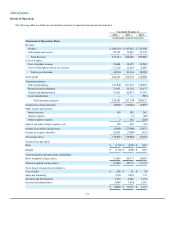
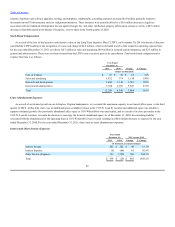
Our revenue increased $9.6 million to $268.4 million for the year ended December 31, 2011. The change in revenue is due to an increase in ROW
Consumer revenues of $7.8 million, partially offset by a $4.0 million decrease in North America Consumer revenue, over the prior year period.
Worldwide Institutional revenues increased $5.8 million over the same period, driven by growth in our education and corporate channels. Bookings,
calculated as revenue plus the change in deferred revenue, decreased to $273.2 million for the year ended December 31, 2011 from $279.9 million for
the year ended December 31, 2010. The decrease was due to a $16.3 million decrease in North America Consumer bookings, partially offset by a
$10.8 million increase in ROW Consumer bookings. Additionally, worldwide Institutional bookings decreased $1.2 million compared to the prior year
period.
We reported an operating loss of $28.4 million for the year ended December 31, 2011 compared to operating income of $12.9 million for the year
ended December 31, 2010. The operating loss was due
57
Interest Income $ 187 $ 302 $ (115) -38.1%
Interest Expense — (5) 5 100.0%
Other Income (Expense) 3 142 (139) -97.9%
Total other income (expense) $ 190 $ 439 $ (249) -56.7%
Income tax expense (benefit) $ 29,991 $ (7,980) $ (37,971) -475.8%