Rosetta Stone 2012 Annual Report Download - page 50
Download and view the complete annual report
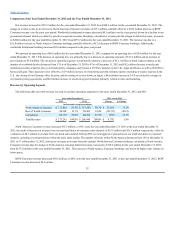
Please find page 50 of the 2012 Rosetta Stone annual report below. You can navigate through the pages in the report by either clicking on the pages listed below, or by using the keyword search tool below to find specific information within the annual report.-
 1
1 -
2
-
3
-
4
-
5
-
6
-
7
-
8
-
9
-
10
-
11
-
12
-
13
-
14
-
15
-
16
-
17
-
18
-
19
-
20
-
21
-
22
-
23
-
24
-
25
-
26
-
27
-
28
-
29
-
30
-
31
-
32
-
33
-
34
-
35
-
36
-
37
-
38
-
39
-
 40
40 -
 41
41 -
 42
42 -
 43
43 -
 44
44 -
 45
45 -
 46
46 -
 47
47 -
 48
48 -
 49
49 -
 50
50 -
 51
51 -
 52
52 -
 53
53 -
 54
54 -
 55
55 -
 56
56 -
 57
57 -
 58
58 -
 59
59 -
 60
60 -
61
-
62
-
63
-
64
-
65
-
66
-
67
-
68
-
69
-
70
-
71
-
72
-
73
-
74
-
75
-
76
-
77
-
78
-
79
-
80
-
81
-
82
-
83
-
84
-
85
-
86
-
87
-
88
-
89
-
90
-
91
-
92
-
93
-
94
-
95
-
96
-
97
-
98
-
99
-
100
-
101
-
102
-
103
-
104
-
105
-
106
-
107
-
108
-
109
-
110
-
111
-
112
-
113
-
114
-
115
-
116
-
117
-
118
-
119
-
120
-
121
-
122
-
123
-
124
-
125
-
126
-
127
-
128
-
129
-
130
-
131
-
132
-
133
-
134
-
135
-
136
-
137
-
138
-
139
-
140
-
141
-
142
-
143
-
144
-
145
-
146
-
147
-
148
-
149
-
150
-
151
-
152
-
153
-
154
-
155
 |
 |

Table of Contents
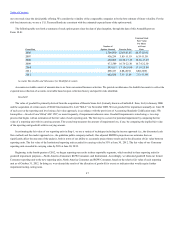
our own stock since the initial public offering. We consider the volatility of the comparable companies to be the best estimate of future volatility. For the
risk-free interest rate, we use a U.S. Treasury Bond rate consistent with the estimated expected term of the option award.
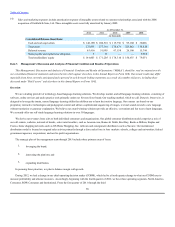
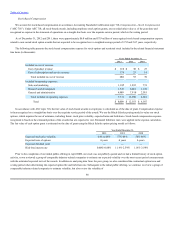
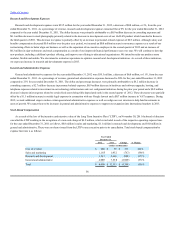
The following table sets forth a summary of stock option grants since the date of plan inception, through the date of this Annual Report on
Form 10-K:
Accounts receivable consist of amounts due to us from our normal business activities. We provide an allowance for doubtful accounts to reflect the
expected non-collection of accounts receivable based on past collection history and specific risks identified.
The value of goodwill is primarily derived from the acquisition of Rosetta Stone Ltd. (formerly known as Fairfield & Sons, Ltd.) in January 2006
and the acquisition of certain assets of SGLC International Co. Ltd ("SGLC") in November 2009. We test goodwill for impairment annually on June 30
of each year at the reporting unit level using a fair value approach, in accordance with the provisions of Accounting Standards Codification topic 350,
("ASC 350") or more frequently, if impairment indicators arise. Goodwill impairment is tested using a two-step
process that begins with an estimation of the fair value of each reporting unit. The first step is a screen for potential impairment by comparing the fair
value of a reporting unit with its carrying amount. The second step measures the amount of impairment loss, if any, by comparing the implied fair value
of the reporting unit goodwill with its carrying amount.
In estimating the fair value of our reporting units in Step 1, we use a variety of techniques including the income approach (i.e., the discounted cash
flow method) and the market approach (i.e., the guideline public company method). Our adjusted EBITDA projections are estimates that can
significantly affect the outcome of the analysis, both in terms of our ability to accurately project future results and in the allocation of fair value between
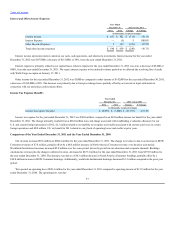
reporting units. The fair value of the Institutional reporting unit exceeded its carrying value by 53% at June 30, 2012. The fair value of our Consumer
reporting unit exceeded its carrying value by 50% at June 30, 2012.
Beginning in the fourth quarter of 2012, we began reporting our results in three reportable segments, which resulted in three reporting units for
goodwill impairment purposes—North America Consumer, ROW Consumer, and Institutional. Accordingly, we allocated goodwill from our former
Consumer reporting unit to the new reporting units, North America Consumer and ROW Consumer, based on the relative fair value of each reporting
unit as of October 31, 2012. In doing so, we evaluated the results of the allocation of goodwill for events or indicators that would require further
impairment testing, noting none.
47
2006 1,704,950 $3.85-$3.85 $4.57-$5.92
2007 436,254 3.85-11.19 6.35-11.30
2008 402,805 10.36-17.49 10.36-17.49
2009 472,589 16.74-22.30 16.74-22.30
2010 593,017 17.10-25.99 17.10-25.99
2011 698,327 6.88-20.91 6.88-20.91
2012 662,856 7.51-13.89 7.51-13.89