Rosetta Stone 2012 Annual Report Download - page 42
Download and view the complete annual report
Please find page 42 of the 2012 Rosetta Stone annual report below. You can navigate through the pages in the report by either clicking on the pages listed below, or by using the keyword search tool below to find specific information within the annual report.-
 1
1 -
2
-
3
-
4
-
5
-
6
-
7
-
8
-
9
-
10
-
11
-
12
-
13
-
14
-
15
-
16
-
17
-
18
-
19
-
20
-
21
-
22
-
23
-
24
-
25
-
26
-
27
-
28
-
29
-
30
-
31
-
 32
32 -
 33
33 -
 34
34 -
 35
35 -
 36
36 -
 37
37 -
 38
38 -
 39
39 -
 40
40 -
 41
41 -
 42
42 -
 43
43 -
 44
44 -
 45
45 -
 46
46 -
 47
47 -
 48
48 -
 49
49 -
 50
50 -
 51
51 -
 52
52 -
53
-
54
-
55
-
56
-
57
-
58
-
59
-
60
-
61
-
62
-
63
-
64
-
65
-
66
-
67
-
68
-
69
-
70
-
71
-
72
-
73
-
74
-
75
-
76
-
77
-
78
-
79
-
80
-
81
-
82
-
83
-
84
-
85
-
86
-
87
-
88
-
89
-
90
-
91
-
92
-
93
-
94
-
95
-
96
-
97
-
98
-
99
-
100
-
101
-
102
-
103
-
104
-
105
-
106
-
107
-
108
-
109
-
110
-
111
-
112
-
113
-
114
-
115
-
116
-
117
-
118
-
119
-
120
-
121
-
122
-
123
-
124
-
125
-
126
-
127
-
128
-
129
-
130
-
131
-
132
-
133
-
134
-
135
-
136
-
137
-
138
-
139
-
140
-
141
-
142
-
143
-
144
-
145
-
146
-
147
-
148
-
149
-
150
-
151
-
152
-
153
-
154
-
155
 |
 |

Table of Contents
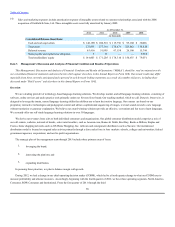
quarter of 2012 we had two operating segments, Consumer and Institutional. Prior to 2011 we operated as a single segment.
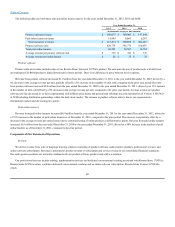
As we focus on balancing growth and margin, we will discuss the profitability of each segment in terms of segment contribution. Segment
contribution is the measure of profitability used by our CODM. Segment contribution includes segment revenue and expenses incurred directly by the
segment, including material costs, service costs, customer care and coaching costs, sales and marketing expense and bad debt expense. North America
Consumer segment contribution improved from 35% for the year ended December 31, 2011 to 41% for the year ended December 31, 2012. The
improvement in North America Consumer segment contribution is due to an increase in revenue of $15.3 million; this achievement is consistent with the
goal established by management at the onset of 2012 to stabilize the U.S. consumer market. ROW Consumer segment contribution improved
$1.8 million from the year ended December 31, 2011 to the year ended December 31, 2012 driven by a reduction in sales and marketing expense of
$12.3 million, primarily the result of kiosk closures. Institutional segment contribution decreased to $25.9 million, or 43%, for the year ended
December 31, 2012 as compared to $34.3 million, or 57%, for the year ended December 31, 2011 primarily due to an increase in sales and marketing
expense related to the addition of sales staff to this group. As our institutional sales team gains traction we anticipate an improvement in contribution
margin.
For additional information regarding our segments, see Note 15 of Item 8, Financial Statements and Supplementary Data. For additional
information regarding fluctuations in segment revenue, see Results of Operations, below. Prior periods are presented consistent with our current
operating segments and definition of segment contribution.
Beginning in 2012 management used the following key business metrics to measure the success of our combined North America and ROW
Consumer segments. Management does not review these metrics at a disaggregated segment level.
• A unit is a perpetual software license sold as either tangible packaged software or as an online download.
• Consumer revenues derived from product software units divided by the number of product
software units sold in the same period. Revenue from product software includes product revenue associated with product licenses in
addition to service revenues associated with short-term online subscriptions that are bundled with our V4 offering.
Approximately $36.00 to $49.00 in revenue per unit is derived from service revenues associated with this short-term online subscription.
• The number of paid, active learners derived from the sale of a primarily online offering as of the end of a specified
period. Applicable online offerings include purchases of subscription-based licenses for Rosetta Stone , subscriptions,
and purchasers of our product software who subsequently purchase renewals of their short-term online services.
• Service revenues derived from paid online learners for a specified period divided by the
average number of paid online learners during the same period, adjusted to a monthly rate. The average number of paid online learners
for a quarter is calculated as the average of the beginning and ending number of paid online learners for the specified period. The average
number of paid online learners for a year-to-date period is calculated as the average of the average number of paid online learners for
quarters included in the specified year-to-date period.
39