Rosetta Stone 2012 Annual Report Download - page 41
Download and view the complete annual report
Please find page 41 of the 2012 Rosetta Stone annual report below. You can navigate through the pages in the report by either clicking on the pages listed below, or by using the keyword search tool below to find specific information within the annual report.-
 1
1 -
2
-
3
-
4
-
5
-
6
-
7
-
8
-
9
-
10
-
11
-
12
-
13
-
14
-
15
-
16
-
17
-
18
-
19
-
20
-
21
-
22
-
23
-
24
-
25
-
26
-
27
-
28
-
29
-
30
-
 31
31 -
 32
32 -
 33
33 -
 34
34 -
 35
35 -
 36
36 -
 37
37 -
 38
38 -
 39
39 -
 40
40 -
 41
41 -
 42
42 -
 43
43 -
 44
44 -
 45
45 -
 46
46 -
 47
47 -
 48
48 -
 49
49 -
 50
50 -
 51
51 -
52
-
53
-
54
-
55
-
56
-
57
-
58
-
59
-
60
-
61
-
62
-
63
-
64
-
65
-
66
-
67
-
68
-
69
-
70
-
71
-
72
-
73
-
74
-
75
-
76
-
77
-
78
-
79
-
80
-
81
-
82
-
83
-
84
-
85
-
86
-
87
-
88
-
89
-
90
-
91
-
92
-
93
-
94
-
95
-
96
-
97
-
98
-
99
-
100
-
101
-
102
-
103
-
104
-
105
-
106
-
107
-
108
-
109
-
110
-
111
-
112
-
113
-
114
-
115
-
116
-
117
-
118
-
119
-
120
-
121
-
122
-
123
-
124
-
125
-
126
-
127
-
128
-
129
-
130
-
131
-
132
-
133
-
134
-
135
-
136
-
137
-
138
-
139
-
140
-
141
-
142
-
143
-
144
-
145
-
146
-
147
-
148
-
149
-
150
-
151
-
152
-
153
-
154
-
155
 |
 |

Table of Contents
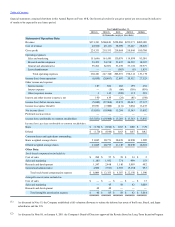
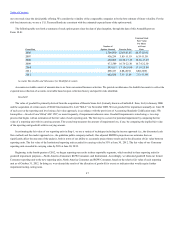
(4) Sales and marketing expenses include amortization expense of intangible assets related to customer relationships associated with the 2006
acquisition of Fairfield & Sons, Ltd. These intangible assets were fully amortized by January 2009.
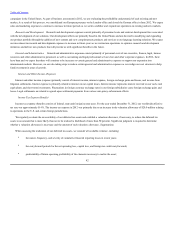
We are a leading provider of technology-based language-learning solutions. We develop, market, and sell language-learning solutions consisting of
software, online services and audio practice tools primarily under our brand. Our teaching method, which we call , is
designed to leverage the innate, natural language-learning ability that children use to learn their native language. Our courses are based on our
proprietary interactive technologies and pedagogical content and utilize a sophisticated sequencing of images, text and sounds to teach a new language
without translation or grammar explanation. We believe our award-winning solutions provide an effective, convenient and fun way to learn languages.
We currently offer our self-study language-learning solutions in over 30 languages.
We derive our revenues from sales to both individual consumers and organizations. Our global consumer distribution model comprises a mix of
our call centers, websites, network of kiosks, select retail resellers, such as Amazon.com, Barnes & Noble, Best Buy, Books-a-Million, Staples and
Costco, home shopping networks such as GS Home Shopping, Inc. in Korea and consignment distributors such as Navarre. Our institutional
distribution model is focused on targeted sales activity primarily through a direct sales force in four markets: schools, colleges and universities; federal
government agencies; corporations; and not-for-profit organizations.
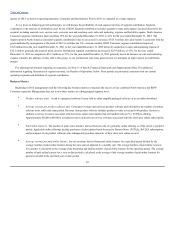
The strategic plan of the management team through 2015 includes three primary areas of focus:
1. leveraging the brand;
2. innovating the platform; and
3. expanding distribution.
In pursuing these priorities, we plan to balance margin with growth.
During 2012, we had a change in our chief operating decision maker (CODM), which led to a fourth quarter change to what our CODM uses to
measure profitability and allocate resources. Accordingly, beginning with the fourth quarter of 2012, we have three operating segments, North America
Consumer, ROW Consumer and Institutional. From the first quarter of 2011 through the third
38
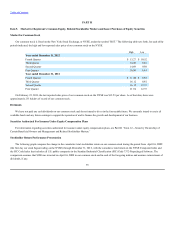
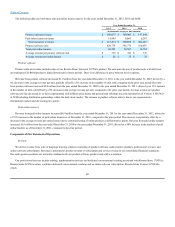
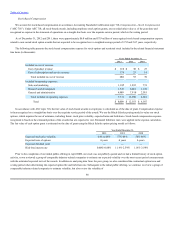
Cash and cash equivalents $ 148,190 $ 106,516 $ 115,756 $ 95,188 $ 30,626
Total assets 275,855 277,181 276,474 225,442 138,818
Deferred revenue 63,416 51,895 47,158 26,106 15,744
Notes payable and capital lease obligation 5 12 — — 9,910
Total stockholders' equity $ 144,603 $ 171,205 $ 178,316 $ 156,435 $ 79,071