Rosetta Stone 2012 Annual Report Download - page 57
Download and view the complete annual report
Please find page 57 of the 2012 Rosetta Stone annual report below. You can navigate through the pages in the report by either clicking on the pages listed below, or by using the keyword search tool below to find specific information within the annual report.-
 1
1 -
2
-
3
-
4
-
5
-
6
-
7
-
8
-
9
-
10
-
11
-
12
-
13
-
14
-
15
-
16
-
17
-
18
-
19
-
20
-
21
-
22
-
23
-
24
-
25
-
26
-
27
-
28
-
29
-
30
-
31
-
32
-
33
-
34
-
35
-
36
-
37
-
38
-
39
-
40
-
41
-
42
-
43
-
44
-
45
-
46
-
 47
47 -
 48
48 -
 49
49 -
 50
50 -
 51
51 -
 52
52 -
 53
53 -
 54
54 -
 55
55 -
 56
56 -
 57
57 -
 58
58 -
 59
59 -
 60
60 -
 61
61 -
 62
62 -
 63
63 -
 64
64 -
 65
65 -
 66
66 -
 67
67 -
68
-
69
-
70
-
71
-
72
-
73
-
74
-
75
-
76
-
77
-
78
-
79
-
80
-
81
-
82
-
83
-
84
-
85
-
86
-
87
-
88
-
89
-
90
-
91
-
92
-
93
-
94
-
95
-
96
-
97
-
98
-
99
-
100
-
101
-
102
-
103
-
104
-
105
-
106
-
107
-
108
-
109
-
110
-
111
-
112
-
113
-
114
-
115
-
116
-
117
-
118
-
119
-
120
-
121
-
122
-
123
-
124
-
125
-
126
-
127
-
128
-
129
-
130
-
131
-
132
-
133
-
134
-
135
-
136
-
137
-
138
-
139
-
140
-
141
-
142
-
143
-
144
-
145
-
146
-
147
-
148
-
149
-
150
-
151
-
152
-
153
-
154
-
155
 |
 |

Table of Contents
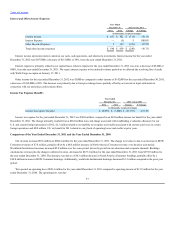
Product revenue decreased $14.5 million to $180.9 million during the year ended December 31, 2012 from $195.4 million during the year ended
December 31, 2011. The decrease in product revenue is caused by a $4.9 million decrease in Institutional product revenues as a result of a shift from
sales of product licenses to sales of renewing online subscriptions as well as due to a decline in Federal stimulus funding which drove sales of our
network CD product. Consumer product revenue decreased $9.6 million driven by lower prices on our Rosetta Stone Version 4 product
software bundle.
Subscription and service revenue increased $19.3 million, or 26%, to $92.3 million for the year ended December 31, 2012. The increase in
subscription and service revenues was due to a $14.6 million increase in consumer online service revenue related to Version 4 as well as a
growing base of exclusively online subscription sales. Institutional subscription and service revenues also increased $4.6 million related to growth in the
institutional customer base with renewing online subscriptions.
We are currently evaluating changes to our products. If we implement additional subscription-based services, it could result in lower revenues over
the next twelve months as revenues would be spread over the subscription period. There was an $11.5 million increase in deferred revenue during the
year ended December 31, 2012, which is primarily related to increased sales of exclusively online subscriptions. In particular, we sold $0.8 million of
online subscription products to Barnes & Noble, as part of our strategy to expand our offerings of online subscription services.
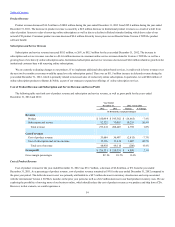
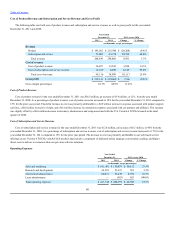
The following table sets forth cost of product revenue and subscription and service revenue, as well as gross profit for the years ended
December 31, 2012 and 2011:
Cost of product revenue for the year ended December 31, 2012 was $33.7 million, a decrease of $2.8 million, or 8% from the year ended
December 31, 2011. As a percentage of product revenue, cost of product revenue remained at 19% for the year ended December 31, 2012 compared to
the prior year period. The dollar decrease in cost was primarily attributable to a $0.7 million decrease in inventory obsolescence and scrap associated
with the international Version 4 launches in the prior year period as well as a $2.2 million decrease in our hard product inventory costs. We are
exploring the possibility of moving more of our business online, which should reduce the cost of product revenue as we produce and ship fewer CDs.
However, in that scenario, we could experience a
54
Product $ 180,919 $ 195,382 $ (14,463) -7.4%
Subscription and service 92,322 73,067 19,255 26.4%
Total revenue 273,241 268,449 4,792 1.8%
Cost of product revenue 33,684 36,497 (2,813) -7.7%
Cost of subscription and service revenue 15,226 12,619 2,607 20.7%
Total cost of revenue 48,910 49,116 (206) -0.4%
$ 224,331 $ 219,333 $ 4,998 2.3%
Gross margin percentages 82.1% 81.7% 0.4%