Rosetta Stone 2012 Annual Report Download - page 113
Download and view the complete annual report
Please find page 113 of the 2012 Rosetta Stone annual report below. You can navigate through the pages in the report by either clicking on the pages listed below, or by using the keyword search tool below to find specific information within the annual report.-
 1
1 -
2
-
3
-
4
-
5
-
6
-
7
-
8
-
9
-
10
-
11
-
12
-
13
-
14
-
15
-
16
-
17
-
18
-
19
-
20
-
21
-
22
-
23
-
24
-
25
-
26
-
27
-
28
-
29
-
30
-
31
-
32
-
33
-
34
-
35
-
36
-
37
-
38
-
39
-
40
-
41
-
42
-
43
-
44
-
45
-
46
-
47
-
48
-
49
-
50
-
51
-
52
-
53
-
54
-
55
-
56
-
57
-
58
-
59
-
60
-
61
-
62
-
63
-
64
-
65
-
66
-
67
-
68
-
69
-
70
-
71
-
72
-
73
-
74
-
75
-
76
-
77
-
78
-
79
-
80
-
81
-
82
-
83
-
84
-
85
-
86
-
87
-
88
-
89
-
90
-
91
-
92
-
93
-
94
-
95
-
96
-
97
-
98
-
99
-
100
-
101
-
102
-
 103
103 -
 104
104 -
 105
105 -
 106
106 -
 107
107 -
 108
108 -
 109
109 -
 110
110 -
 111
111 -
 112
112 -
 113
113 -
 114
114 -
 115
115 -
 116
116 -
 117
117 -
 118
118 -
 119
119 -
 120
120 -
 121
121 -
 122
122 -
 123
123 -
124
-
125
-
126
-
127
-
128
-
129
-
130
-
131
-
132
-
133
-
134
-
135
-
136
-
137
-
138
-
139
-
140
-
141
-
142
-
143
-
144
-
145
-
146
-
147
-
148
-
149
-
150
-
151
-
152
-
153
-
154
-
155
 |
 |

Table of Contents
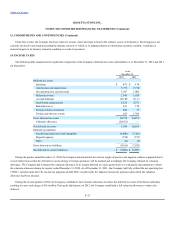
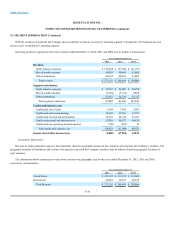
With the exception of goodwill, the Company does not identify or allocate its assets by operating segment. Consequently, the Company does not
present assets or liabilities by operating segment.
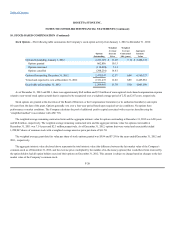
Operating results by segment for the twelve months ended December 31, 2012, 2011 and 2010 were as follows (in thousands):
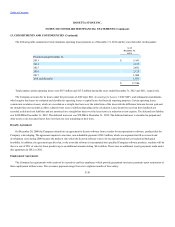
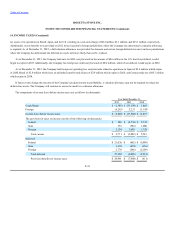
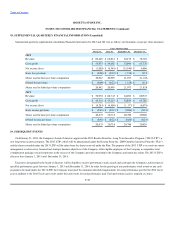
Revenue by major geographic region is based primarily upon the geographic location of the customers who purchase the Company's products. The
geographic locations of distributors and resellers who purchase and resell the Company's products may be different from the geographic locations of
end customers.
The information below summarizes revenue from customers by geographic area for the years ended December 31, 2012, 2011 and 2010,
respectively (in thousands):
F-36
North America consumer $ 172,826 $ 157,561 $ 161,575
Rest of world consumer 40,248 50,465 42,688
Global institutional 60,167 60,423 54,605
Total revenue $ 273,241 $ 268,449 $ 258,868
North America consumer $ 70,767 $ 54,985 $ 58,459
Rest of world consumer (3,536) (5,317) 9,628
Global institutional 25,857 34,270 35,317
Total segment contribution 93,088 83,938 103,404
Unallocated cost of sales 6,104 7,042 5,265
Unallocated sales and marketing 16,633 22,581 13,571
Unallocated research and development 23,455 24,145 23,247
Unallocated general and administrative 52,926 58,577 48,424
Unallocated non-operating income/(expense) (190) (439) 24
Total unallocated expenses, net 98,928 111,906 90,531
United States $ 223,747 $ 212,122 $ 212,629
International 49,494 56,327 46,239
Total Revenue $ 273,241 $ 268,449 $ 258,868