Rosetta Stone 2012 Annual Report Download - page 39
Download and view the complete annual report
Please find page 39 of the 2012 Rosetta Stone annual report below. You can navigate through the pages in the report by either clicking on the pages listed below, or by using the keyword search tool below to find specific information within the annual report.-
 1
1 -
2
-
3
-
4
-
5
-
6
-
7
-
8
-
9
-
10
-
11
-
12
-
13
-
14
-
15
-
16
-
17
-
18
-
19
-
20
-
21
-
22
-
23
-
24
-
25
-
26
-
27
-
28
-
 29
29 -
 30
30 -
 31
31 -
 32
32 -
 33
33 -
 34
34 -
 35
35 -
 36
36 -
 37
37 -
 38
38 -
 39
39 -
 40
40 -
 41
41 -
 42
42 -
 43
43 -
 44
44 -
 45
45 -
 46
46 -
 47
47 -
 48
48 -
 49
49 -
50
-
51
-
52
-
53
-
54
-
55
-
56
-
57
-
58
-
59
-
60
-
61
-
62
-
63
-
64
-
65
-
66
-
67
-
68
-
69
-
70
-
71
-
72
-
73
-
74
-
75
-
76
-
77
-
78
-
79
-
80
-
81
-
82
-
83
-
84
-
85
-
86
-
87
-
88
-
89
-
90
-
91
-
92
-
93
-
94
-
95
-
96
-
97
-
98
-
99
-
100
-
101
-
102
-
103
-
104
-
105
-
106
-
107
-
108
-
109
-
110
-
111
-
112
-
113
-
114
-
115
-
116
-
117
-
118
-
119
-
120
-
121
-
122
-
123
-
124
-
125
-
126
-
127
-
128
-
129
-
130
-
131
-
132
-
133
-
134
-
135
-
136
-
137
-
138
-
139
-
140
-
141
-
142
-
143
-
144
-
145
-
146
-
147
-
148
-
149
-
150
-
151
-
152
-
153
-
154
-
155
 |
 |

Table of Contents
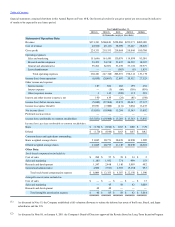
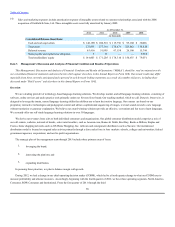
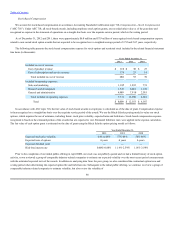
financial statements contained elsewhere in this Annual Report on Form 10-K. Our historical results for any prior period are not necessarily indicative
of results to be expected in any future period.
(1) As discussed in Note 15, the Company established a full valuation allowance to reduce the deferred tax assets of the Korea, Brazil, and Japan
subsidiaries and the U.S.
(2) As discussed in Note 10, on January 4, 2011 the Company's Board of Directors approved the Rosetta Stone Inc Long-Term Incentive Program
Revenue $273,241 $268,449 $258,868 $252,271 $209,380
Cost of revenue 48,910 49,116 38,999 33,427 28,676
Gross profit 224,331 219,333 219,869 218,844 180,704
Operating expenses:
Sales and marketing 151,646 161,491 130,879 114,899 93,384
Research and development 23,453 24,218 23,437 26,239 18,387
General and administrative 55,262 62,031 53,239 57,182 39,577
Lease abandonment — — (583) (8) 1,831
Total operating expenses 230,361 247,740 206,972 198,312 153,179
Income (loss) from operations (6,030) (28,407) 12,897 20,532 27,525
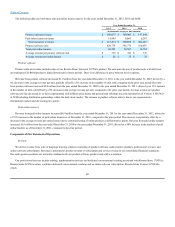
Other income and expense:
Interest income 187 302 262 159 454
Interest expense — (5) (66) (356) (891)
Other (expense) income 3 142 (220) 112 239
Interest and other income (expense), net 190 439 (24) (85) (198)
Income (loss) before income taxes (5,840) (27,968) 12,873 20,447 27,327
Income tax expense (benefit) 29,991 (7,980) (411) 7,084 13,435
Net income (loss) (35,831) (19,988) 13,284 13,363 13,892
Preferred stock accretion — — — — —
Income (loss) attributable to common stockholders $ (35,831) $ (19,988) $ 13,284 $ 13,363 $ 13,892
Income (loss) per share attributable to common stockholders:
Basic $ (1.70) $ (0.96) $ 0.65 $ 0.89 $ 7.29
Diluted $ (1.70) $ (0.96) $ 0.63 $ 0.67 $ 0.82
Common shares and equivalents outstanding:
Basic weighted average shares 21,045 20,773 20,439 14,990 1,905
Diluted weighted average shares 21,045 20,773 21,187 19,930 16,924
Cost of sales $ 288 $ 55 $ 39 $ 34 $ 2
Sales and marketing 1,185 1,932 774 999 153
Research and development 1,547 2,448 1,181 5,959 482
General and administrative 4,989 7,918 2,393 15,158 953
Total stock-based compensation expense $ 8,009 $ 12,353 $ 4,387 $ 22,150 $ 1,590
Cost of sales $ — $ — $ — $ — $ 13
Sales and marketing — 45 58 42 3,003
Research and development 40 40 — — —
Total intangible amortization expense $ 40 $ 85 $ 58 $ 42 $ 3,016