Redbox 2010 Annual Report Download - page 91
Download and view the complete annual report
Please find page 91 of the 2010 Redbox annual report below. You can navigate through the pages in the report by either clicking on the pages listed below, or by using the keyword search tool below to find specific information within the annual report.-
 1
1 -
2
-
3
-
4
-
5
-
6
-
7
-
8
-
9
-
10
-
11
-
12
-
13
-
14
-
15
-
16
-
17
-
18
-
19
-
20
-
21
-
22
-
23
-
24
-
25
-
26
-
27
-
28
-
29
-
30
-
31
-
32
-
33
-
34
-
35
-
36
-
37
-
38
-
39
-
40
-
41
-
42
-
43
-
44
-
45
-
46
-
47
-
48
-
49
-
50
-
51
-
52
-
53
-
54
-
55
-
56
-
57
-
58
-
59
-
60
-
61
-
62
-
63
-
64
-
65
-
66
-
67
-
68
-
69
-
70
-
71
-
72
-
73
-
74
-
75
-
76
-
77
-
78
-
79
-
80
-
 81
81 -
 82
82 -
 83
83 -
 84
84 -
 85
85 -
 86
86 -
 87
87 -
 88
88 -
 89
89 -
 90
90 -
 91
91 -
 92
92 -
 93
93 -
 94
94 -
 95
95 -
 96
96 -
 97
97 -
 98
98 -
 99
99 -
 100
100 -
 101
101 -
102
-
103
-
104
-
105
-
106
 |
 |

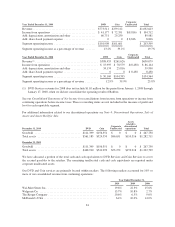
The effect of derivative instruments on our Consolidated Statements of Net Income was as follows (in
thousands):
Derivatives in Cash Flow Hedging Relationships
Effective Portion of
Derivative Gain/(Loss)
Recognized in OCI
Effective Portion of
Derivative Gain/(Loss)
Reclassified from
Accumulated OCI into
Income During the Period
Year Ended December 31, 2010
Interest Rate Swap Contracts .................... $4,477 $(5,553)
Year Ended December 31, 2009
Interest Rate Swap Contracts .................... $2,092 $(5,673)
Year Ended December 31, 2008
Interest Rate Swap Contracts .................... $(7,466) $ (232)
NOTE 18: FAIR VALUE
Because of the nature of the underlying transactions and the short-term maturities involved, we believe the
carrying amounts for cash and cash equivalents, accounts receivable, accounts payables and our revolving line of
credit approximate fair value, which is the amount for which the instrument could be exchanged in a current
transaction between willing parties.
Factors used in determining the fair value of our financial assets and liabilities are summarized into three broad
categories:
• Level 1: Observable inputs such as quoted prices in active markets for identical assets or liabilities;
• Level 2: Inputs other than quoted prices that are observable for the asset or liability, either directly or
indirectly; these include quoted prices for similar assets or liabilities in active markets and quoted
prices for identical or similar assets or liabilities in markets that are not active; or
• Level 3: Unobservable inputs that reflect the reporting entity’s own assumptions.
The factors or methodology used for valuing securities are not necessarily an indication of the risk associated
with investing in those securities.
Following are the disclosures related to our financial assets and (liabilities) that are measured at fair value (in
thousands):
Fair Value at December 31, 2010 Level 1 Level 2 Level 3
Money market fund and certificate of deposit ................ $41,598 $ 0 $ 0
Interest rate swap liability ................................ $ 0 $ (896) $ 0
Callable convertible debt ................................ $ 0 $(180,889) $ 0
Assets held for sale ..................................... $ 0 $ 0 $43,634
Fair Value at December 31, 2009
Money market fund and certificate of deposit ................ $ 9,496 $ 0 $ 0
Interest rate swap liability ................................ $ 0 $ (5,374) $ 0
Convertible debt ....................................... $ 0 $(167,068) $ 0
We determine fair value for our money market funds and certificates of deposit based on quoted market price.
83