Redbox 2010 Annual Report Download - page 59
Download and view the complete annual report
Please find page 59 of the 2010 Redbox annual report below. You can navigate through the pages in the report by either clicking on the pages listed below, or by using the keyword search tool below to find specific information within the annual report.-
 1
1 -
2
-
3
-
4
-
5
-
6
-
7
-
8
-
9
-
10
-
11
-
12
-
13
-
14
-
15
-
16
-
17
-
18
-
19
-
20
-
21
-
22
-
23
-
24
-
25
-
26
-
27
-
28
-
29
-
30
-
31
-
32
-
33
-
34
-
35
-
36
-
37
-
38
-
39
-
40
-
41
-
42
-
43
-
44
-
45
-
46
-
47
-
48
-
 49
49 -
 50
50 -
 51
51 -
 52
52 -
 53
53 -
 54
54 -
 55
55 -
 56
56 -
 57
57 -
 58
58 -
 59
59 -
 60
60 -
 61
61 -
 62
62 -
 63
63 -
 64
64 -
 65
65 -
 66
66 -
 67
67 -
 68
68 -
 69
69 -
70
-
71
-
72
-
73
-
74
-
75
-
76
-
77
-
78
-
79
-
80
-
81
-
82
-
83
-
84
-
85
-
86
-
87
-
88
-
89
-
90
-
91
-
92
-
93
-
94
-
95
-
96
-
97
-
98
-
99
-
100
-
101
-
102
-
103
-
104
-
105
-
106
 |
 |

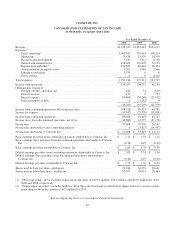
COINSTAR, INC.
CONSOLIDATED STATEMENTS OF CASH FLOWS
(in thousands)
For the Year Ended
December 31,
2010 2009 2008
Operating Activities:
Net income .................................................................................... $ 51,008 $ 57,270 $ 28,549
Adjustments to reconcile net income to net cash flows provided by operating activities from continuing operations:
Depreciation and other ....................................................................... 123,687 86,418 56,424
Amortization of intangible assets and deferred financing fees ......................................... 5,338 5,037 3,975
Share-based payments ....................................................................... 16,016 8,816 8,430
Excess tax benefits on share-based payments ..................................................... (6,887) 0 0
Deferred income taxes ....................................................................... 41,395 14,682 12,099
Income from equity investments ............................................................... 0 0 375
(Income) loss from discontinued operations, net of tax .............................................. 14,886 (13,577) 17,178
Loss on early retirement of debt ................................................................ 0 1,082 0
Non-cash interest on convertible debt ........................................................... 6,037 1,918 0
Other ..................................................................................... 666 861 1,083
Cash provided (used) by changes in operating assets and liabilities from continuing operations:
Accounts receivable ......................................................................... (7,087) (3,450) 1,169
DVD library ............................................................................... (44,985) (27,736) (39,204)
Prepaid expenses and other current assets ........................................................ (9,295) (2,224) (5,828)
Other assets ................................................................................ 1,793 (1,724) (614)
Accounts payable ........................................................................... 81,368 (12,774) 51,764
Accrued payable to retailers ................................................................... 4,252 (5,601) 7,107
Other accrued liabilities ...................................................................... 37,427 14,892 27,163
Net cash provided by operating activities from continuing operations ........................... 315,619 123,890 169,670
Investing Activities:
Purchase of property and equipment ................................................................ (170,847) (148,467) (144,052)
Proceeds from sale of property and equipment ........................................................ 1,143 291 0
Cash paid for acquisition, net of cash acquired ........................................................ 0 71 (24,829)
Proceeds from sale of E-pay Business ............................................................... 26,617 0 0
Net cash used by investing activities from continuing operations ............................... (143,087) (148,105) (168,881)
Financing Activities:
Principal payments on capital lease obligations and other debt ............................................ (36,312) (27,204) (16,983)
Proceeds from capital lease financing ............................................................... 0 22,020 0
Net borrowings (payments) on credit facility .......................................................... (75,000) 42,500 13,000
Pay-off of term loan ............................................................................. 0 (87,500) 0
Issuance of convertible debt, net of underwriting discounts and commissions of $6,000 ........................ 0 194,000 0
Financing costs associated with revolving line of credit and convertible debt ................................ 0 (3,984) 0
Cash used to purchase remaining non-controlling interests in Redbox ...................................... 0 (113,867) 0
Excess tax benefits related to share-based payments .................................................... 6,887 0 0
Repurchase of common stock ...................................................................... (49,245) 0 0
Proceeds from exercise of stock options ............................................................. 31,624 15,974 8,629
Net cash provided (used) by financing activities from continuing operations ..................... (122,046) 41,939 4,646
Effect of exchange rate changes on cash ................................................................ (637) 3,466 (8,967)
Increase (decrease) in cash and cash equivalents, cash in machine or in transit, and cash being processed from
continuing operations ............................................................................. 49,849 21,190 (3,532)
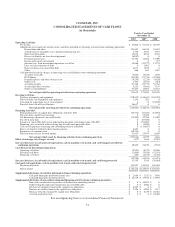
Cash flows from discontinued operations:
Operating cash flows ............................................................................ (9,524) (8,272) 20,968
Investing cash flows ............................................................................. (2,600) (5,026) (32,191)
Financing cash flows ............................................................................ (166) (2,536) (5,248)
(12,290) (15,834) (16,471)
Increase (decrease) in cash and cash equivalents, cash in machine or in transit, and cash being processed ........ 37,559 5,356 (20,003)
Cash and cash equivalents, cash in machine or in transit, and cash being processed:
Beginning of period ............................................................................. 145,857 140,501 160,504
End of period .................................................................................. $183,416 $ 145,857 $ 140,501
Supplemental disclosure of cash flow information from continuing operations:
Cash paid during the period for income taxes ................................................. $ 2,668 $ 1,332 $ 3,636
Cash paid during the period for interest ...................................................... $ 26,219 $ 27,970 $ 13,959
Supplemental disclosure of non-cash investing and financing activities from continuing operations:
Non-cash consideration for purchase of Redbox non-controlling interest ............................ $ 0 $ 48,493 $ 0
Underwriting discount and commissions on convertible debt ..................................... $ 0 $ 6,000 $ 0
Purchase of computers financed by capital lease obligations ...................................... $ 4,883 $ 0 $ 0
Purchase of vehicles financed by capital lease obligations ....................................... $ 2,196 $ 4,960 $ 1,113
Purchase of kiosks financed by capital lease obligations ......................................... $ 0 $ 8,439 $ 20,384
Accrued acquisition costs ................................................................. $ 0 $ 0 $ 10,000
See accompanying Notes to Consolidated Financial Statements.
51