Redbox 2010 Annual Report Download - page 35
Download and view the complete annual report
Please find page 35 of the 2010 Redbox annual report below. You can navigate through the pages in the report by either clicking on the pages listed below, or by using the keyword search tool below to find specific information within the annual report.-
 1
1 -
2
-
3
-
4
-
5
-
6
-
7
-
8
-
9
-
10
-
11
-
12
-
13
-
14
-
15
-
16
-
17
-
18
-
19
-
20
-
21
-
22
-
23
-
24
-
 25
25 -
 26
26 -
 27
27 -
 28
28 -
 29
29 -
 30
30 -
 31
31 -
 32
32 -
 33
33 -
 34
34 -
 35
35 -
 36
36 -
 37
37 -
 38
38 -
 39
39 -
 40
40 -
 41
41 -
 42
42 -
 43
43 -
 44
44 -
 45
45 -
46
-
47
-
48
-
49
-
50
-
51
-
52
-
53
-
54
-
55
-
56
-
57
-
58
-
59
-
60
-
61
-
62
-
63
-
64
-
65
-
66
-
67
-
68
-
69
-
70
-
71
-
72
-
73
-
74
-
75
-
76
-
77
-
78
-
79
-
80
-
81
-
82
-
83
-
84
-
85
-
86
-
87
-
88
-
89
-
90
-
91
-
92
-
93
-
94
-
95
-
96
-
97
-
98
-
99
-
100
-
101
-
102
-
103
-
104
-
105
-
106
 |
 |

revenue, which reflected a 6.7% increase in same store revenue, primarily driven by an increase in our coin-
counting transaction fee.
The decrease in Coin Services segment operating income in 2009 compared to 2008 was primarily due to the
decline in Coin Services revenue, which was driven by a $5.5 million decrease due to unfavorable foreign
exchange rates. Approximately 90% of the negative currency exchange impact was related to the United
Kingdom market as the British pound depreciated against the U.S. dollar in 2009 as compared to the exchange
rate in 2008. Excluding currency fluctuations, Coin Services revenue increased $3.0 million, or 1.1%, in 2009
compared to 2008, with an approximately 4% decline in same store sales.
Changes in income from operations for both our DVD Services and Coin Services segments were generally
driven by the same factors as those driving changes in segment operating income discussed above.
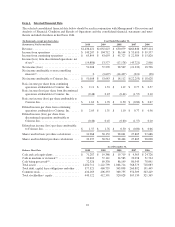
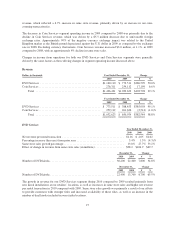
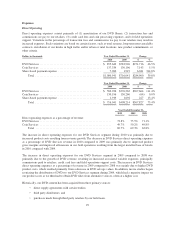
Revenue
Dollars in thousands Year Ended December 31, Change
2010 2009 $ %
DVD Services .......................................... $1,160,110 $ 773,511 $386,599 50.0%
Coin Services ........................................... 276,311 259,112 17,199 6.6%
Total ............................................. $1,436,421 $1,032,623 $403,798 39.1%
Year Ended December 31, Change
2009 2008 $ %
DVD Services .......................................... $ 773,511 $ 388,453 $385,058 99.1%
Coin Services ........................................... 259,112 261,626 (2,514) (1.0)%
Total ............................................. $1,032,623 $ 650,079 $382,544 58.8%
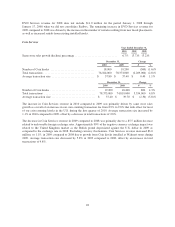
DVD Services
Year Ended December 31,
2010 2009 2008
Net revenue per rental transaction ........................................... $2.16 $ 2.05 $2.02
Percentage increase (decrease) from prior year ................................. 5.4% 1.5% (4.3)%
Same store sales growth percentage .......................................... 13.0% 27.7% 53.2%
Effect of change in revenue from same store sales (in millions) .................... $98.2 $104.9 $69.7
December 31, Change
2010 2009 # %
Number of DVD kiosks ............................................. 30,200 22,400 7,800 34.8%
December 31, Change
2009 2008 # %
Number of DVD kiosks ............................................. 22,400 13,700 8,700 63.5%
The growth in revenue for our DVD Services segment during 2010 compared to 2009 resulted primarily from
new kiosk installations at our retailers’ locations, as well as increases in same store sales and higher net revenue
per rental transaction in 2010 compared with 2009. Same store sales growth was primarily a result of our efforts
to provide customers with stronger titles and increased availability of those titles, as well as an increase in the
number of dual kiosks included in our retailer locations.
27