Redbox 2010 Annual Report Download - page 38
Download and view the complete annual report
Please find page 38 of the 2010 Redbox annual report below. You can navigate through the pages in the report by either clicking on the pages listed below, or by using the keyword search tool below to find specific information within the annual report.-
 1
1 -
2
-
3
-
4
-
5
-
6
-
7
-
8
-
9
-
10
-
11
-
12
-
13
-
14
-
15
-
16
-
17
-
18
-
19
-
20
-
21
-
22
-
23
-
24
-
25
-
26
-
27
-
 28
28 -
 29
29 -
 30
30 -
 31
31 -
 32
32 -
 33
33 -
 34
34 -
 35
35 -
 36
36 -
 37
37 -
 38
38 -
 39
39 -
 40
40 -
 41
41 -
 42
42 -
 43
43 -
 44
44 -
 45
45 -
 46
46 -
 47
47 -
 48
48 -
49
-
50
-
51
-
52
-
53
-
54
-
55
-
56
-
57
-
58
-
59
-
60
-
61
-
62
-
63
-
64
-
65
-
66
-
67
-
68
-
69
-
70
-
71
-
72
-
73
-
74
-
75
-
76
-
77
-
78
-
79
-
80
-
81
-
82
-
83
-
84
-
85
-
86
-
87
-
88
-
89
-
90
-
91
-
92
-
93
-
94
-
95
-
96
-
97
-
98
-
99
-
100
-
101
-
102
-
103
-
104
-
105
-
106
 |
 |

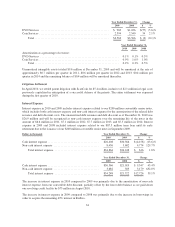
Upon entering into our DVD supply agreements with Warner, Universal Studios and Fox during 2010, we no
longer use our field team to purchase DVD content from third party retailers and there are no longer any studios
restricting the distribution of DVDs to us. Our direct supply agreements with studios provide for a lower initial
product cost than a purchase from a distributor; however, we typically cannot re-sell this product at the end of its
rental term, resulting in no salvage value. In addition, some of the direct supply agreements provide that a
percentage of the rental revenue be shared with the movie studios. The cost of DVDs procured through direct
supply agreements with movie studios comprised 89%, 30% and 4% of the total cost of DVD purchases during
2010, 2009 and 2008, respectively. We expect the DVDs procured through our direct supply agreements with the
studios to continue to comprise the majority of our DVD purchases.
If we do not have a direct supply agreement with a movie studio, we purchase DVD content from distributors.
These purchases are at a higher initial product cost than the direct supply agreements with movie studios;
however, we attempt to re-sell the product at the end of its rental term. Over the last two years, we have
experienced steady declines in the salvage values of product purchased from distributors. As we have entered
into several direct supply agreements with movie studios, the value of DVDs procured through purchases from
distributors has declined substantially and comprised 9%, 59% and 94% of the total cost of DVD purchases
during 2010, 2009 and 2008, respectively.
In the past, when a movie studio had restricted the distribution of DVDs to our DVD Services segment, our field
team procured the product from third party retailers or wholesale distributors. No studios are currently restricting
the distribution of DVDs to us. The DVDs purchased through these alternative procurement sources were
acquired at a higher cost and typically in less advantageous quantities than our other two procurement sources.
The value of DVDs acquired through the alternative procurement sources comprised 2%, 11% and 2% of the
total cost of DVD purchases during 2010, 2009 and 2008 respectively.
The increases in direct operating expenses for our Coin Services segment in 2010 compared to 2009 was due to
higher revenue related to the coin-counting fee increase resulting in higher costs paid to our retail partners for
revenue share expenses. In addition, we experienced higher operating costs related to kiosk field operations, bank
fees and kiosk property tax expense in 2010 compared to 2009.
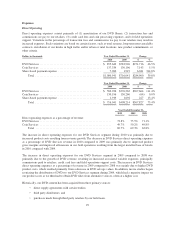
Marketing
Our marketing expenses represent our cost of advertising, traditional marketing, on-line marketing, and public
relations efforts in national and regional advertising and major international markets.
Dollars in thousands Year Ended December 31, Change
2010 2009 $ %
DVD Services ............................................. $14,726 $ 8,212 $6,514 79.3%
Coin Services .............................................. 9,092 7,242 1,850 25.5%
Share-based payment expense ................................. 18 25 (7) (28.0)%
Total ................................................. $23,836 $15,479 $8,357 54.0%
Year Ended December 31, Change
2009 2008 $ %
DVD Services ............................................. $ 8,212 $ 7,018 $1,194 17.0%
Coin Services .............................................. 7,242 7,682 (440) (5.7)%
Share-based payment expense ................................. 25 50 (25) (50.0)%
Total ................................................. $15,479 $14,750 $ 729 4.9%
30