Redbox 2010 Annual Report Download - page 72
Download and view the complete annual report
Please find page 72 of the 2010 Redbox annual report below. You can navigate through the pages in the report by either clicking on the pages listed below, or by using the keyword search tool below to find specific information within the annual report.-
 1
1 -
2
-
3
-
4
-
5
-
6
-
7
-
8
-
9
-
10
-
11
-
12
-
13
-
14
-
15
-
16
-
17
-
18
-
19
-
20
-
21
-
22
-
23
-
24
-
25
-
26
-
27
-
28
-
29
-
30
-
31
-
32
-
33
-
34
-
35
-
36
-
37
-
38
-
39
-
40
-
41
-
42
-
43
-
44
-
45
-
46
-
47
-
48
-
49
-
50
-
51
-
52
-
53
-
54
-
55
-
56
-
57
-
58
-
59
-
60
-
61
-
 62
62 -
 63
63 -
 64
64 -
 65
65 -
 66
66 -
 67
67 -
 68
68 -
 69
69 -
 70
70 -
 71
71 -
 72
72 -
 73
73 -
 74
74 -
 75
75 -
 76
76 -
 77
77 -
 78
78 -
 79
79 -
 80
80 -
 81
81 -
 82
82 -
83
-
84
-
85
-
86
-
87
-
88
-
89
-
90
-
91
-
92
-
93
-
94
-
95
-
96
-
97
-
98
-
99
-
100
-
101
-
102
-
103
-
104
-
105
-
106
 |
 |

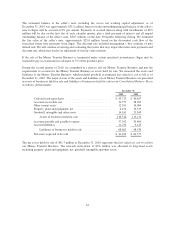
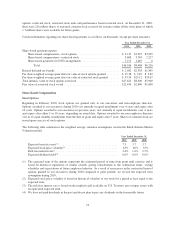
The major classes of assets and liabilities of our discontinued operations are presented in assets of businesses
held for sale and liabilities of businesses held for sale on our Consolidated Balance Sheets. The December 31,
2010 balances include our Money Transfer Business and the December 31, 2009 balances include both Money
Transfer Business and E-payment Business (in thousands):
December 31,
2010 2009
Cash and cash equivalents ................................. $ 45,713 $ 46,439
Accounts receivable, net .................................. 31,577 42,106
Inventory .............................................. 0 8,836
Other current assets ...................................... 12,391 12,608
Property, plant and equipment, net .......................... 6,474 13,856
Goodwill and other assets ................................. 14,161 35,473
Assets of businesses held for sale ....................... 110,316 159,318
Accounts payable and payable to agents ...................... 57,392 77,359
Accrued liabilities ....................................... 11,270 11,591
Liabilities of businesses held for sale .................... 68,662 88,950
Net assets sold or expected to be sold ........................ $ 41,654 $ 70,368
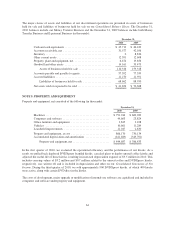
NOTE 5: PROPERTY AND EQUIPMENT
Property and equipment, net consisted of the following (in thousands):
December 31,
2010 2009
Machines ............................................. $791,014 $ 689,283
Computers and software ................................. 49,603 23,824
Office furniture and equipment ........................... 3,845 3,108
Vehicles ............................................. 10,661 11,289
Leasehold improvements ................................ 11,047 2,630
Property and equipment, at cost ........................... 866,170 730,134
Accumulated depreciation and amortization ................. (421,483) (343,701)
Property and equipment, net .......................... $444,687 $ 386,433
In the first quarter of 2010, we evaluated the operational efficiency and the performance of our kiosks. As a
result, we pulled back deployed DVDXpress branded kiosks, canceled plans to deploy unused coffee kiosks and
adjusted the useful life of those kiosks, resulting in increased depreciation expense of $9.5 million in 2010. This
includes carrying values of $3.2 million and $0.7 million related to the unused coffee and DVDXpress kiosks,
respectively, was written off and is included in depreciation and other on our Consolidated Statements of Net
Income. During the third quarter of 2010, we sold approximately 900 DVDXpress kiosks, of which 400 kiosks
were active, along with certain DVD discs in the kiosks.
The costs of development, major upgrade or modification of internal-use software are capitalized and included in
computers and software under property and equipment.
64