Redbox 2010 Annual Report Download - page 83
Download and view the complete annual report
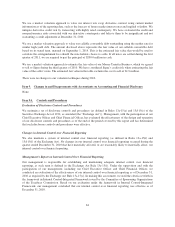
Please find page 83 of the 2010 Redbox annual report below. You can navigate through the pages in the report by either clicking on the pages listed below, or by using the keyword search tool below to find specific information within the annual report.-
 1
1 -
2
-
3
-
4
-
5
-
6
-
7
-
8
-
9
-
10
-
11
-
12
-
13
-
14
-
15
-
16
-
17
-
18
-
19
-
20
-
21
-
22
-
23
-
24
-
25
-
26
-
27
-
28
-
29
-
30
-
31
-
32
-
33
-
34
-
35
-
36
-
37
-
38
-
39
-
40
-
41
-
42
-
43
-
44
-
45
-
46
-
47
-
48
-
49
-
50
-
51
-
52
-
53
-
54
-
55
-
56
-
57
-
58
-
59
-
60
-
61
-
62
-
63
-
64
-
65
-
66
-
67
-
68
-
69
-
70
-
71
-
72
-
 73
73 -
 74
74 -
 75
75 -
 76
76 -
 77
77 -
 78
78 -
 79
79 -
 80
80 -
 81
81 -
 82
82 -
 83
83 -
 84
84 -
 85
85 -
 86
86 -
 87
87 -
 88
88 -
 89
89 -
 90
90 -
 91
91 -
 92
92 -
 93
93 -
94
-
95
-
96
-
97
-
98
-
99
-
100
-
101
-
102
-
103
-
104
-
105
-
106
 |
 |

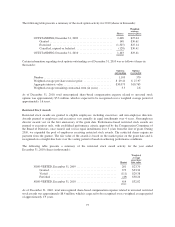
The following table presents a summary of the stock option activity for 2010 (shares in thousands):
Shares
Weighted
average
exercise price
OUTSTANDING, December 31, 2009 ....................... 2,408 $27.04
Granted ............................................ 148 $30.61
Exercised .......................................... (1,325) $25.14
Cancelled, expired or forfeited .......................... (128) $30.41
OUTSTANDING, December 31, 2010 ....................... 1,103 $29.41
Certain information regarding stock options outstanding as of December 31, 2010 was as follows (shares in
thousands):
Options
outstanding
Options
exercisable
Number ............................................... 1,103 370
Weighted average per share exercise price ................... $ 29.41 $ 27.97
Aggregate intrinsic value ................................. $30,075 $10,763
Weighted average remaining contractual term (in years) ........ 3.5 2.6
As of December 31, 2010, total unrecognized share-based compensation expense related to unvested stock
options was approximately $5.3 million, which is expected to be recognized over a weighted average period of
approximately 1.6 years.
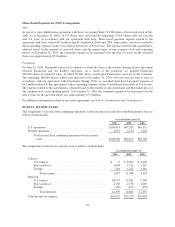
Restricted Stock Awards
Restricted stock awards are granted to eligible employees, including executives, and non-employee directors.
Awards granted to employees and executives vest annually in equal installments over 4 years. Non-employee
director awards vest on the first anniversary of the grant date. Performance-based restricted stock awards are
granted to executives only, with established performance criteria approved by the Compensation Committee of
the Board of Directors, once earned, and vest in equal installments over 3 years from the date of grant. During
2010, we expanded the pool of employees receiving restricted stock awards. The restricted shares require no
payment from the grantee. The fair value of the awards is based on the market price on the grant date and is
recognized on a straight-line basis over the vesting period or based on achieving performance conditions.
The following table presents a summary of the restricted stock award activity for the year ended
December 31, 2010 (shares in thousands):
Shares
Weighted
average
grant date
fair value
NON-VESTED, December 31, 2009 ............................ 201 $23.70
Granted ............................................... 373 $33.34
Vested ............................................... (111) $29.38
Forfeited .............................................. (49) $30.24
NON-VESTED, December 31, 2010 ............................ 414 $32.82
As of December 31, 2010, total unrecognized share-based compensation expense related to unvested restricted
stock awards was approximately $8.4 million, which is expected to be recognized over a weighted average period
of approximately 1.9 years.
75