Redbox 2010 Annual Report Download - page 33
Download and view the complete annual report
Please find page 33 of the 2010 Redbox annual report below. You can navigate through the pages in the report by either clicking on the pages listed below, or by using the keyword search tool below to find specific information within the annual report.-
 1
1 -
2
-
3
-
4
-
5
-
6
-
7
-
8
-
9
-
10
-
11
-
12
-
13
-
14
-
15
-
16
-
17
-
18
-
19
-
20
-
21
-
22
-
 23
23 -
 24
24 -
 25
25 -
 26
26 -
 27
27 -
 28
28 -
 29
29 -
 30
30 -
 31
31 -
 32
32 -
 33
33 -
 34
34 -
 35
35 -
 36
36 -
 37
37 -
 38
38 -
 39
39 -
 40
40 -
 41
41 -
 42
42 -
 43
43 -
44
-
45
-
46
-
47
-
48
-
49
-
50
-
51
-
52
-
53
-
54
-
55
-
56
-
57
-
58
-
59
-
60
-
61
-
62
-
63
-
64
-
65
-
66
-
67
-
68
-
69
-
70
-
71
-
72
-
73
-
74
-
75
-
76
-
77
-
78
-
79
-
80
-
81
-
82
-
83
-
84
-
85
-
86
-
87
-
88
-
89
-
90
-
91
-
92
-
93
-
94
-
95
-
96
-
97
-
98
-
99
-
100
-
101
-
102
-
103
-
104
-
105
-
106
 |
 |

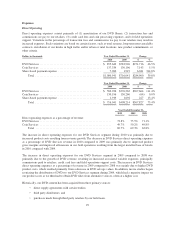
additional revenue and provide a broader product offering. Same store sales reflects the change in revenue from
locations that have been open for more than 13 months by the end of the reporting period compared to the same
locations in the same period of the prior year.
RESULTS OF OPERATIONS
Comparability of Data
Our discussion and analysis that follows covers our results from continuing operations, which consists of our DVD
Services and Coin Services business segments. We have recast the prior period results to reflect our discontinued
operations, which consist of our Money Transfer Business, which we agreed to sell during 2010, and our E-Pay
Business and Entertainment Business, which we sold in 2010 and 2009, respectively. Additionally, our operating
costs included in our shared service functions, which consist primarily of sales, corporate executive management,
finance, legal, human resources, and information technology, are allocated to our DVD Services and Coin Services
business segments. We will periodically evaluate the shared service allocations for segment reporting purposes,
which may result in changes to segment allocations in future periods. We have made changes within our
organization that align with our decision to focus on our two core automated retailing businesses, our DVD Services
and Coin Services business segments. As a result, we modified the methodology of allocating shared service costs
in 2010 based on the relative revenue from these core businesses and made a determination not to allocate shared
service costs to our discontinued operations due to their self-sustained operating model and insignificant revenue
from their operations. In addition, we have recast our 2009 and 2008 shared service allocation using the current year
methodology to provide a comparable year-over-year analysis.
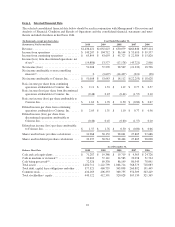
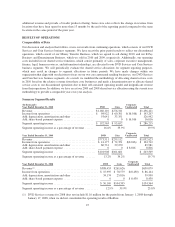
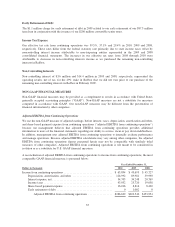
Summary Segment Results
(In thousands)
Year Ended December 31, 2010 DVD Coin
Corporate
Unallocated Total
Revenue .......................................... $1,160,110 $276,311 $1,436,421
Income from operations .............................. $ 98,922 $ 60,301 $(16,016) $ 143,207
Add: depreciation, amortization and other ............... 93,641 33,351 126,992
Add: share-based payment expense ..................... 0 0 $16,016 16,016
Segment operating income ............................ $ 192,563 $ 93,652 $ 286,215
Segment operating income as a percentage of revenue ...... 16.6% 33.9% 19.9%
Year Ended December 31, 2009 DVD Coin
Corporate
Unallocated Total
Revenue ............................................ $773,511 $259,112 $1,032,623
Income from operations ............................... $ 41,177 $ 72,351 $(8,816) $ 104,712
Add: depreciation, amortization and other ................. 60,731 29,250 89,981
Add: share-based payment expense ...................... 0 0 $8,816 8,816
Segment operating income ............................. $101,908 $101,601 $ 203,509
Segment operating income as a percentage of revenue ....... 13.2% 39.2% 19.7%
Year Ended December 31, 2008 DVD Coin
Corporate
Unallocated Total
Revenue(1) ............................................ $388,453 $261,626 $650,079
Income from operations ................................. $ 15,995 $ 78,579 $(8,430) $ 86,144
Add: depreciation, amortization and other .................. 34,174 25,816 59,990
Add: share-based payment expense ........................ 0 0 $8,430 8,430
Segment operating income ............................... $ 50,169 $104,395 $154,564
Segment operating income as a percentage of revenue ......... 12.9% 39.9% 23.8%
(1) DVD Services revenue for 2008 does not include $11.0 million for the period from January 1, 2008 through
January 17, 2008, when we did not consolidate the operating results of Redbox.
25