Redbox 2010 Annual Report Download - page 87
Download and view the complete annual report
Please find page 87 of the 2010 Redbox annual report below. You can navigate through the pages in the report by either clicking on the pages listed below, or by using the keyword search tool below to find specific information within the annual report.-
 1
1 -
2
-
3
-
4
-
5
-
6
-
7
-
8
-
9
-
10
-
11
-
12
-
13
-
14
-
15
-
16
-
17
-
18
-
19
-
20
-
21
-
22
-
23
-
24
-
25
-
26
-
27
-
28
-
29
-
30
-
31
-
32
-
33
-
34
-
35
-
36
-
37
-
38
-
39
-
40
-
41
-
42
-
43
-
44
-
45
-
46
-
47
-
48
-
49
-
50
-
51
-
52
-
53
-
54
-
55
-
56
-
57
-
58
-
59
-
60
-
61
-
62
-
63
-
64
-
65
-
66
-
67
-
68
-
69
-
70
-
71
-
72
-
73
-
74
-
75
-
76
-
 77
77 -
 78
78 -
 79
79 -
 80
80 -
 81
81 -
 82
82 -
 83
83 -
 84
84 -
 85
85 -
 86
86 -
 87
87 -
 88
88 -
 89
89 -
 90
90 -
 91
91 -
 92
92 -
 93
93 -
 94
94 -
 95
95 -
 96
96 -
 97
97 -
98
-
99
-
100
-
101
-
102
-
103
-
104
-
105
-
106
 |
 |

We did not provide for U.S. income taxes on undistributed earnings of foreign operations because they were
considered permanently invested outside of the U.S. Upon repatriation, some of these earnings would generate
foreign tax credits, which may reduce the U.S. tax liability associated with any future foreign dividend. At
December 31, 2010, the cumulative amount of earnings upon which U.S. income taxes have not been provided
was approximately $12.6 million.
The income tax benefit realized from stock option exercises in excess of the amounts recognized in the
Consolidated Statements of Net Income was approximately $6.8 million in 2010 and zero in 2009 and 2008.
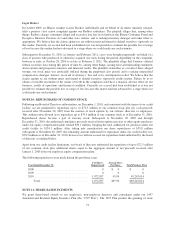
NOTE 13: NET INCOME PER SHARE
Basic earnings per share (“EPS”) is computed by dividing the net income available to common stockholders for
the period by the weighted average number of common shares outstanding during the period. Diluted EPS is
computed by dividing the net income available to common stockholders for the period by the weighted average
number of common and dilutive potential common shares outstanding during the period.
Net income used for calculating basic and diluted EPS is the same for all periods presented. The following table
sets forth the computation of shares used for the basic and diluted EPS calculations (in thousands):
Year Ended December 31,
2010 2009 2008
Weighted average shares used for basic EPS ................................. 31,268 30,152 28,041
Dilutive effect of stock options and other stock-based awards ................... 489 362 423
Dilutive effect of convertible debt ......................................... 640 0 0
Weighted average shares used for diluted EPS ............................... 32,397 30,514 28,464
Stock options and other stock-based awards not included in diluted EPS calculation
because they were antidilutive .......................................... 349 1,407 1,150
Shares related to convertible debt not included in diluted EPS calculation because
they were antidilutive ................................................. 0 1,511 0
NOTE 14: RETIREMENT PLANS
In July 1995, we adopted a tax-qualified employee savings and retirement plan under Section 401(k) of the
Internal Revenue Code of 1986 for all employees who satisfy the age and service requirements under this plan.
This plan is funded by voluntary employee salary deferral of up to 60% of annual compensation (subject to the
Federal limitation) and a safe harbor employer match equaling 100% of the first 3% and 50% of the next 2%.
Additionally, all participating employees are 100% vested for all Coinstar matched contributions on the day of
match. We contributed $2.6 million, $1.4 million and $1.2 million to the plan for the years ended December 31,
2010, 2009 and 2008, respectively. Our Redbox subsidiary also sponsors a separate 401(k) plan with a matching
contribution equal to 25% of employee contributions up to 4% of their compensation. Matching contributions for
the Redbox 401(k) plan vest over a four-year period and totaled $0.06 million in 2010, $0.5 million in 2009 and
$0.18 million in 2008. This plan has been frozen to new contributions and matching contributions effective
January 1, 2010.
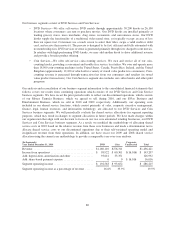
NOTE 15: BUSINESS SEGMENT AND ENTERPRISE-WIDE INFORMATION
Management, including our chief operating decision maker, our chief executive officer, evaluates the
performance of our business segments based primarily on segment revenue and segment operating income from
continuing operations before depreciation, amortization and other, and share-based payment expense (“segment
operating income”), a non-GAAP financial measure.
79