Redbox 2010 Annual Report Download - page 41
Download and view the complete annual report
Please find page 41 of the 2010 Redbox annual report below. You can navigate through the pages in the report by either clicking on the pages listed below, or by using the keyword search tool below to find specific information within the annual report.-
 1
1 -
2
-
3
-
4
-
5
-
6
-
7
-
8
-
9
-
10
-
11
-
12
-
13
-
14
-
15
-
16
-
17
-
18
-
19
-
20
-
21
-
22
-
23
-
24
-
25
-
26
-
27
-
28
-
29
-
30
-
 31
31 -
 32
32 -
 33
33 -
 34
34 -
 35
35 -
 36
36 -
 37
37 -
 38
38 -
 39
39 -
 40
40 -
 41
41 -
 42
42 -
 43
43 -
 44
44 -
 45
45 -
 46
46 -
 47
47 -
 48
48 -
 49
49 -
 50
50 -
 51
51 -
52
-
53
-
54
-
55
-
56
-
57
-
58
-
59
-
60
-
61
-
62
-
63
-
64
-
65
-
66
-
67
-
68
-
69
-
70
-
71
-
72
-
73
-
74
-
75
-
76
-
77
-
78
-
79
-
80
-
81
-
82
-
83
-
84
-
85
-
86
-
87
-
88
-
89
-
90
-
91
-
92
-
93
-
94
-
95
-
96
-
97
-
98
-
99
-
100
-
101
-
102
-
103
-
104
-
105
-
106
 |
 |

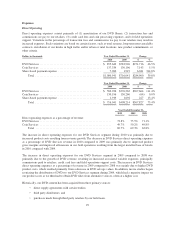
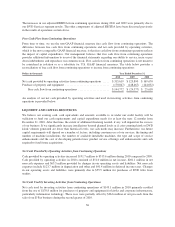
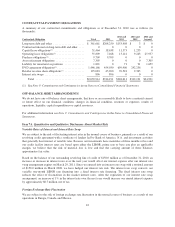
Depreciation and other
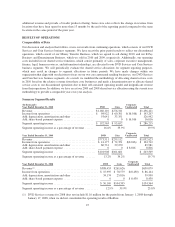
Our depreciation and other expenses consist primarily of depreciation charges on our installed kiosks as well as
on computer equipment and leased automobiles.
Dollars in thousands Year Ended December 31, Change
2010 2009 $ %
DVD Services ............................................ $ 92,884 $59,762 $33,122 55.4%
Coin Services ............................................. 30,803 26,656 4,147 15.6%
Total ................................................ $123,687 $86,418 $37,269 43.1%
Year Ended December 31, Change
2009 2008 $ %
DVD Services ............................................ $ 59,762 $33,147 $26,615 80.3%
Coin Services ............................................. 26,656 23,277 3,379 14.5%
Total ................................................ $ 86,418 $56,424 $29,994 53.2%
Year Ended December 31,
2010 2009 2008
Depreciation and Other as a percentage of revenue:
DVD Services ............................................................ 8.0% 7.7% 8.5%
Coin Services ............................................................ 11.1% 10.3% 8.9%
Total ............................................................... 8.6% 8.4% 8.7%
The increase in our DVD Services segment depreciation and other in 2010 compared to 2009 was primarily due
to depreciation expense associated with the net installation of 7,800 DVD kiosks during 2010. Additionally, in
the first quarter of 2010, we evaluated the operational efficiency and the performance of our kiosks, and as a
result, we pulled back deployed DVDXpress branded kiosks and canceled plans to deploy unused coffee kiosks.
As a result, we adjusted the useful life of those kiosks, resulting in increased depreciation expense of $9.5 million
in 2010. This included carrying values of $0.7 million and $3.2 million related to the unused DVDXpress and
coffee kiosks, respectively, were written off and included in depreciation and other on our Consolidated
Statements of Net Income.
The increases in DVD Services and Coin Services depreciation and other expense in 2009 compared to 2008
were primarily due to the net installation of 8,700 DVD kiosks in 2009 and the rollout of coin kiosks to
approximately 3,500 Walmart locations, primarily in the latter half of 2008, driving increased depreciation
expense in 2009.
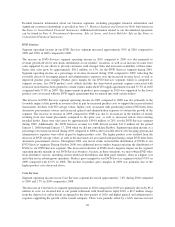
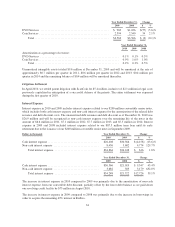
Amortization of Intangible Assets
Our amortization expense consists of amortization of intangible assets, which are mainly comprised of the value
assigned to our acquired retailer relationships.
Dollars in thousands Year Ended December 31, Change
2010 2009 $ %
DVD Services .............................................. $ 757 $ 969 $(212) (21.9)%
Coin Services ............................................... 2,548 2,594 (46) (1.8)%
Total .................................................. $3,305 $3,563 $(258) (7.2)%
33