Redbox 2010 Annual Report Download - page 32
Download and view the complete annual report
Please find page 32 of the 2010 Redbox annual report below. You can navigate through the pages in the report by either clicking on the pages listed below, or by using the keyword search tool below to find specific information within the annual report.-
 1
1 -
2
-
3
-
4
-
5
-
6
-
7
-
8
-
9
-
10
-
11
-
12
-
13
-
14
-
15
-
16
-
17
-
18
-
19
-
20
-
21
-
 22
22 -
 23
23 -
 24
24 -
 25
25 -
 26
26 -
 27
27 -
 28
28 -
 29
29 -
 30
30 -
 31
31 -
 32
32 -
 33
33 -
 34
34 -
 35
35 -
 36
36 -
 37
37 -
 38
38 -
 39
39 -
 40
40 -
 41
41 -
 42
42 -
43
-
44
-
45
-
46
-
47
-
48
-
49
-
50
-
51
-
52
-
53
-
54
-
55
-
56
-
57
-
58
-
59
-
60
-
61
-
62
-
63
-
64
-
65
-
66
-
67
-
68
-
69
-
70
-
71
-
72
-
73
-
74
-
75
-
76
-
77
-
78
-
79
-
80
-
81
-
82
-
83
-
84
-
85
-
86
-
87
-
88
-
89
-
90
-
91
-
92
-
93
-
94
-
95
-
96
-
97
-
98
-
99
-
100
-
101
-
102
-
103
-
104
-
105
-
106
 |
 |

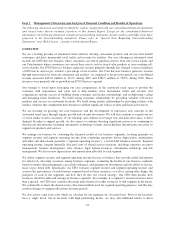
Item 7. Management’s Discussion and Analysis of Financial Condition and Results of Operations
The following discussion and analysis should be read in conjunction with our consolidated financial statements
and related notes thereto included elsewhere in this Annual Report. Except for the consolidated historical
information, the following discussion contains forward-looking statements. Actual results could differ from those
projected in the forward-looking statements. Please refer to “Special Note Regarding Forward-Looking
Statements” and “Risk Factors” elsewhere in this Annual Report.
OVERVIEW
We are a leading provider of automated retail solutions offering convenient products and services that benefit
consumers and drive incremental retail traffic and revenue for retailers. Our core offerings in automated retail
include our DVD Services business where consumers can rent or purchase movies from self-service kiosks and
our Coin business where consumers can convert their coin to cash or stored value products at coin-counting self-
service kiosks. Our DVD Services business generates revenue primarily through fees charged to rent or purchase
a DVD movie, and we pay retailers a percentage of our revenue. Our Coin Services business generates revenue
through transaction fees from our consumers and retailers. As compared to the previous period, our consolidated
revenue increased $403.8 million or 39.1% during 2010 and $382.5 million or 58.8% during 2009. These
increases were primarily due to growth in our DVD Services segment.
Our strategy is based upon leveraging our core competencies in the automated retail space to provide the
consumer with convenience and value and to help retailers drive incremental traffic and revenue. Our
competencies include success in building strong consumer and retailer relationships, and in deploying, scaling
and managing kiosk businesses. We build strong consumer relationships by providing valuable self-service
products and services in convenient locations. We build strong retailer relationships by providing retailers with
turnkey solutions that complement their businesses without significant outlays of time and financial resources.
We are focusing on growing our core businesses and the development of innovative new concepts in the
automated retail space through organic growth and external investment. We will also continue to expand our use
of social media to drive awareness of our offerings and continue to leverage new and innovative ideas to drive
demand. In order to support growth, we also expect to continue devoting significant resources to continuing to
develop our infrastructure including information technology systems and technology infrastructure necessary to
support our products and services.
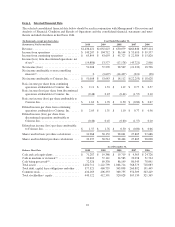
We manage our business by evaluating the financial results of our business segments, focusing primarily on
segment revenue and segment operating income from continuing operations before depreciation, amortization
and other and share-based payments (“segment operating income”), a non-GAAP financial measure. Segment
operating income contains internally allocated costs of shared service functions, including corporate executive
management, business development, sales, finance, legal, human resources, information technology and risk
management. We also review depreciation and amortization allocated to each segment.
We utilize segment revenue and segment operating income because we believe they provide useful information
for effectively allocating resources among business segments, evaluating the health of our business segments
based on metrics that management can actively influence, and gauging our investments and our ability to service,
incur or pay down debt. Specifically, our CEO evaluates segment revenue and segment operating income, and
assesses the performance of each business segment based on these measures, as well as, among other things, the
prospects of each of the segments and how they fit into our overall strategy. Our CEO then decides how
resources should be allocated among our business segments. For example, if a segment’s revenue increases more
than expected, our CEO may consider allocating more financial or other resources to that segment in the future.
We continually evaluate the shared service allocation methods used for segment reporting purposes, and this may
result in changes to segment allocations in future periods.
We also review same store sales which we calculate for our segments on a location basis. Most of our locations
have a single kiosk, but in locations with high performing kiosks, we may add additional kiosks to drive
24