Redbox 2010 Annual Report Download - page 90
Download and view the complete annual report
Please find page 90 of the 2010 Redbox annual report below. You can navigate through the pages in the report by either clicking on the pages listed below, or by using the keyword search tool below to find specific information within the annual report.-
 1
1 -
2
-
3
-
4
-
5
-
6
-
7
-
8
-
9
-
10
-
11
-
12
-
13
-
14
-
15
-
16
-
17
-
18
-
19
-
20
-
21
-
22
-
23
-
24
-
25
-
26
-
27
-
28
-
29
-
30
-
31
-
32
-
33
-
34
-
35
-
36
-
37
-
38
-
39
-
40
-
41
-
42
-
43
-
44
-
45
-
46
-
47
-
48
-
49
-
50
-
51
-
52
-
53
-
54
-
55
-
56
-
57
-
58
-
59
-
60
-
61
-
62
-
63
-
64
-
65
-
66
-
67
-
68
-
69
-
70
-
71
-
72
-
73
-
74
-
75
-
76
-
77
-
78
-
79
-
 80
80 -
 81
81 -
 82
82 -
 83
83 -
 84
84 -
 85
85 -
 86
86 -
 87
87 -
 88
88 -
 89
89 -
 90
90 -
 91
91 -
 92
92 -
 93
93 -
 94
94 -
 95
95 -
 96
96 -
 97
97 -
 98
98 -
 99
99 -
 100
100 -
101
-
102
-
103
-
104
-
105
-
106
 |
 |

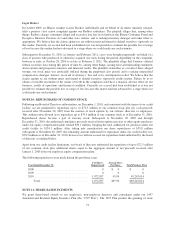
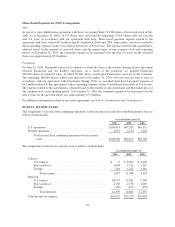
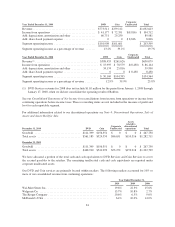
Revenue is allocated to geographic locations based on the location of the DVD Services or Coin Services kiosk.
Revenue by geographic location was as follows (in thousands):
Year Ended December 31,
2010 2009 2008
U.S. ........................................................ $1,395,821 $ 995,884 $611,644
All other .................................................... 40,600 36,739 38,435
Total ................................................... $1,436,421 $1,032,623 $650,079
Long-lived assets by geographic location were as follows (in thousands):
December 31,
2010 2009 2008
U.S. ........................................................ $775,208 $765,124 $577,916
All other .................................................... 19,109 17,598 14,079
Total ................................................... $794,317 $782,722 $591,995
NOTE 16: RELATED PARTY AND OTHER TRANSACTIONS
In the second quarter of 2008, we settled a proxy contest, which resulted in one additional member to our Board
of Directors, and one additional independent director to be added by March 1, 2009. Expenses related to this
proxy contest, including the solicitation of stockholders, were approximately $4.1 million.
NOTE 17: DERIVATIVE INSTRUMENTS
Interest Rate Swaps
As of December 31, 2010, we had one interest rate swap agreement outstanding to hedge against the potential
impact on earnings from an increase in market interest rates associated with the interest payments on our
variable-rate revolving credit facility with Wells Fargo Bank for a notional amount of $150.0 million with an
expiration date of March 20, 2011. Our previously outstanding interest rate swap agreement with JP Morgan
Chase for a notional amount of $75.0 million with an expiration date of October 28, 2010 was terminated on
August 4, 2010 as the underlying revolving debt of $75.0 million was paid off. The fair value of the interest rate
swap at the time of the termination was a liability of $0.4 million, which was reversed from comprehensive
income (loss) and recognized as interest expense in our Consolidated Statements of Net Income during the third
quarter of 2010.
Under the interest rate swap agreement, we receive or make payments on a monthly basis, based on the
differential between a specific interest rate and one-month LIBOR. The interest rate swap is accounted for as a
cash flow hedge. The fair value of the swaps, which was a liability of $0.9 million and $5.4 million at
December 31, 2010 and 2009, respectively, was recorded as a component of other accrued liabilities in our
Consolidated Balance Sheets, with a corresponding adjustment to comprehensive income (loss). Estimated losses
in accumulated comprehensive income (loss) at December 31, 2010 are expected to be reclassified into earnings
as a component of interest expense over the next three months. All gains and losses were included in
management’s assessment of hedge effectiveness and the amount of the net gain or loss included in our
Consolidated Statements of Net Income representing the amount of hedge ineffectiveness was inconsequential in
all periods presented.
82