Redbox 2010 Annual Report Download - page 34
Download and view the complete annual report
Please find page 34 of the 2010 Redbox annual report below. You can navigate through the pages in the report by either clicking on the pages listed below, or by using the keyword search tool below to find specific information within the annual report.-
 1
1 -
2
-
3
-
4
-
5
-
6
-
7
-
8
-
9
-
10
-
11
-
12
-
13
-
14
-
15
-
16
-
17
-
18
-
19
-
20
-
21
-
22
-
23
-
 24
24 -
 25
25 -
 26
26 -
 27
27 -
 28
28 -
 29
29 -
 30
30 -
 31
31 -
 32
32 -
 33
33 -
 34
34 -
 35
35 -
 36
36 -
 37
37 -
 38
38 -
 39
39 -
 40
40 -
 41
41 -
 42
42 -
 43
43 -
 44
44 -
45
-
46
-
47
-
48
-
49
-
50
-
51
-
52
-
53
-
54
-
55
-
56
-
57
-
58
-
59
-
60
-
61
-
62
-
63
-
64
-
65
-
66
-
67
-
68
-
69
-
70
-
71
-
72
-
73
-
74
-
75
-
76
-
77
-
78
-
79
-
80
-
81
-
82
-
83
-
84
-
85
-
86
-
87
-
88
-
89
-
90
-
91
-
92
-
93
-
94
-
95
-
96
-
97
-
98
-
99
-
100
-
101
-
102
-
103
-
104
-
105
-
106
 |
 |
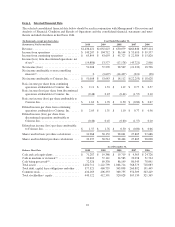
Detailed financial information about our business segments, including geographic financial information and
significant customer relationships is provided in Note 15: Business Segment and Enterprise-Wide Information in
the Notes to Consolidated Financial Statements. Additional information related to our discontinued operations
can be found in Note 4: Discontinued Operations, Sale of Assets, and Assets Held for Sale in the Notes to
Consolidated Financial Statements.
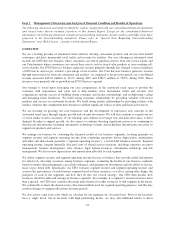
DVD Services
Segment operating income in our DVD Services segment increased approximately 89% in 2010 compared to
2009 and 103% in 2009 compared to 2008.
The increase in DVD Services segment operating income in 2010 compared to 2009 was due primarily to
revenue growth driven by new kiosk installations at our retailers’ locations, as well as an increase in same store
sales supported by our efforts to provide customers with stronger titles and increased availability of those titles.
Same store sales grew by approximately $98.2 million, or 13%, for the DVD Services segment during 2010.
Segment operating income as a percentage of revenue increased during 2010 compared to 2009, reflecting the
favorable effects of leveraging general and administrative expenses over the increased revenue level, as well as
improved product gross margin. Product gross margin for our DVD Services segment, which is computed as
segment revenue, less DVD product costs (which includes the share-based payment expense associated with
restricted stock that has been granted to certain studios under the DVD supply agreements) totaled 57.3% in 2010
compared with 57.0% in 2009. The improvement in product gross margins in 2010 was supported by the lower
product costs associated with the DVD supply agreements that we entered into with certain studios.
The increase in DVD Services segment operating income in 2009 compared to 2008 was due primarily to the
favorable impact of the growth in revenue offset in part by increased product costs to support the increased rental
transactions, declines in DVD salvage values, higher costs associated with purchasing certain DVD titles from
alternative procurement sources and increased general and administration expenses to sustain the growth of the
segment. The increase in revenue in 2009 compared to 2008 was due to an increase in the number of rentals
resulting from new kiosk placements compared to the prior year, as well as increased rentals from existing
installed kiosks. Same store sales grew by approximately $104.9 million, or 28%, for the DVD Services segment
during 2009. Additionally, the DVD Services revenue for 2008 did not include $11.0 million for the period
January 1, 2008 through January 17, 2008 when we did not consolidate Redbox. Segment operating income as a
percentage of revenue increased during 2009 compared to 2008 as the favorable effects of leveraging general and
administrative expenses were offset in part by higher product costs. The higher product costs resulted from the
decrease in DVD salvage values, as well as the increased cost associated with purchasing certain DVD titles from
alternative procurement sources. Throughout 2009, one movie studio restricted the distribution of DVDs to our
DVD Services segment. During October 2009, two additional movie studios began restricting the distribution of
DVDs to our DVD Services segment. The increased restriction of DVDs had a negative impact on the segment
operating income margins in our DVD Services business, because, in these situations, we must obtain DVD titles
from alternative sources, including certain wholesale distributors and third party retailers, often at a higher cost
and often not in advantageous quantities. Product gross margin for our DVD Services segment totaled 57.0% in
2009 compared with 62.9% in 2008. The decline in product gross margins in 2009 was primarily due to the
higher product costs discussed above.
Coin Services
Segment operating income in our Coin Services segment decreased approximately 7.8% during 2010 compared
to 2009 and 2.7% in 2009 compared to 2008.
The decrease in Coin Services segment operating income in 2010 compared to 2009 was primarily driven by $5.4
million in costs we incurred due to our patent settlement with ScanCoin in April 2010, a $3.2 million charge
from the disposal of coffee kiosks recognized in the first quarter of 2010 and higher general and administrative
expenses supporting the growth of the overall company. These were partially offset by a 6.6% increase in total
26