Redbox 2010 Annual Report Download - page 89
Download and view the complete annual report
Please find page 89 of the 2010 Redbox annual report below. You can navigate through the pages in the report by either clicking on the pages listed below, or by using the keyword search tool below to find specific information within the annual report.-
 1
1 -
2
-
3
-
4
-
5
-
6
-
7
-
8
-
9
-
10
-
11
-
12
-
13
-
14
-
15
-
16
-
17
-
18
-
19
-
20
-
21
-
22
-
23
-
24
-
25
-
26
-
27
-
28
-
29
-
30
-
31
-
32
-
33
-
34
-
35
-
36
-
37
-
38
-
39
-
40
-
41
-
42
-
43
-
44
-
45
-
46
-
47
-
48
-
49
-
50
-
51
-
52
-
53
-
54
-
55
-
56
-
57
-
58
-
59
-
60
-
61
-
62
-
63
-
64
-
65
-
66
-
67
-
68
-
69
-
70
-
71
-
72
-
73
-
74
-
75
-
76
-
77
-
78
-
 79
79 -
 80
80 -
 81
81 -
 82
82 -
 83
83 -
 84
84 -
 85
85 -
 86
86 -
 87
87 -
 88
88 -
 89
89 -
 90
90 -
 91
91 -
 92
92 -
 93
93 -
 94
94 -
 95
95 -
 96
96 -
 97
97 -
 98
98 -
 99
99 -
100
-
101
-
102
-
103
-
104
-
105
-
106
 |
 |

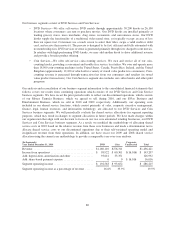
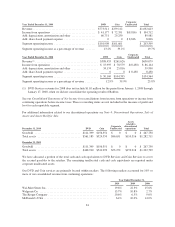
Year Ended December 31, 2009 DVD Coin
Corporate
Unallocated Total
Revenue ............................................ $773,511 $259,112 $1,032,623
Income from operations ............................... $ 41,177 $ 72,351 $(8,816) $ 104,712
Add: depreciation, amortization and other ................. 60,731 29,250 89,981
Add: share-based payment expense ...................... 0 0 $8,816 8,816
Segment operating income ............................. $101,908 $101,601 $ 203,509
Segment operating income as a percentage of revenue ....... 13.2% 39.2% 19.7%
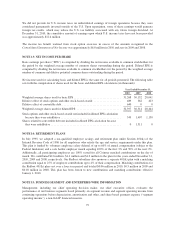
Year Ended December 31, 2008 DVD Coin
Corporate
Unallocated Total
Revenue(1) ............................................ $388,453 $261,626 $650,079
Income from operations ................................. $ 15,995 $ 78,579 $(8,430) $ 86,144
Add: depreciation, amortization and other .................. 34,174 25,816 59,990
Add: share-based payment expense ........................ 0 0 $8,430 8,430
Segment operating income ............................... $ 50,169 $104,395 $154,564
Segment operating income as a percentage of revenue ......... 12.9% 39.9% 23.8%
(1) DVD Services revenue for 2008 does not include $11.0 million for the period from January 1, 2008 through
January 17, 2008, when we did not consolidate the operating results of Redbox.
See our Consolidated Statements of Net Income for reconciliations from income from operations to income from
continuing operations before income taxes. These reconciling items are not included in the measure of profit and
loss for each reportable segment.
For additional information related to our discontinued operations see Note 4: Discontinued Operations, Sale of
Assets and Assets Held for Sale.
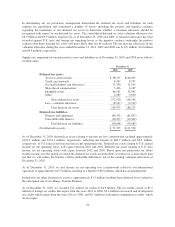
December 31, 2010 DVD Coin
Corporate
Unallocated
Assets
related to
discontinued
operations Total
Goodwill ................................ $111,399 $156,351 $ 0 $ 0 $ 267,750
Total assets .............................. $561,185 $524,559 $86,651 $110,316 $1,282,711
December 31, 2009
Goodwill ................................ $111,399 $156,351 $ 0 $ 0 $ 267,750
Total assets .............................. $468,910 $541,299 $53,272 $159,318 $1,222,799
We have allocated a portion of the total cash and cash equivalents to DVD Services and Coin Services to cover
the accrued payables to the retailers. The remaining unallocated cash and cash equivalents are reported under
corporate unallocated assets.
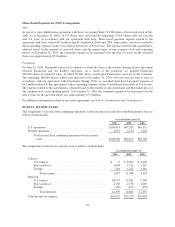
Our DVD and Coin services are primarily located within retailers. The following retailers accounted for 10% or
more of our consolidated revenue from continuing operations:
Year Ended December 31,
2010 2009 2008
Wal-Mart Stores Inc. .......................................... 19.6% 22.3% 15.6%
Walgreen Co. ................................................ 13.7% 10.8% 2.7%
The Kroger Company .......................................... 10.6% 6.5% 9.0%
McDonald’s USA ............................................. 6.4% 10.0% 14.0%
81