Redbox 2010 Annual Report Download - page 28
Download and view the complete annual report
Please find page 28 of the 2010 Redbox annual report below. You can navigate through the pages in the report by either clicking on the pages listed below, or by using the keyword search tool below to find specific information within the annual report.-
 1
1 -
2
-
3
-
4
-
5
-
6
-
7
-
8
-
9
-
10
-
11
-
12
-
13
-
14
-
15
-
16
-
17
-
 18
18 -
 19
19 -
 20
20 -
 21
21 -
 22
22 -
 23
23 -
 24
24 -
 25
25 -
 26
26 -
 27
27 -
 28
28 -
 29
29 -
 30
30 -
 31
31 -
 32
32 -
 33
33 -
 34
34 -
 35
35 -
 36
36 -
 37
37 -
 38
38 -
39
-
40
-
41
-
42
-
43
-
44
-
45
-
46
-
47
-
48
-
49
-
50
-
51
-
52
-
53
-
54
-
55
-
56
-
57
-
58
-
59
-
60
-
61
-
62
-
63
-
64
-
65
-
66
-
67
-
68
-
69
-
70
-
71
-
72
-
73
-
74
-
75
-
76
-
77
-
78
-
79
-
80
-
81
-
82
-
83
-
84
-
85
-
86
-
87
-
88
-
89
-
90
-
91
-
92
-
93
-
94
-
95
-
96
-
97
-
98
-
99
-
100
-
101
-
102
-
103
-
104
-
105
-
106
 |
 |

PART II
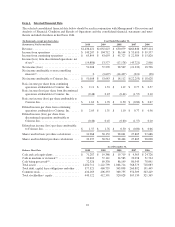
Item 5. Market for Registrant’s Common Equity, Related Stockholder Matters and Issuer Purchases of
Equity Securities
Market Information and Stock Prices
Our common stock is traded on the NASDAQ Global Select Market under the symbol “CSTR.” The following
table sets forth the high and low bid prices per share as reported by the NASDAQ Global Select Market for our
common stock for each quarter during the last two fiscal years. The quotations represent inter-dealer prices
without retail markup, markdown or commission and may not necessarily represent actual transactions.
2009 High Low
Quarter 1 .................................................. $33.00 $18.84
Quarter 2 .................................................. 37.67 25.00
Quarter 3 .................................................. 38.28 24.79
Quarter 4 .................................................. 36.00 23.49
2010 High Low
Quarter 1 .................................................. $33.58 $25.37
Quarter 2 .................................................. 59.43 32.27
Quarter 3 .................................................. 50.16 38.75
Quarter 4 .................................................. 67.56 41.47
The approximate number of holders of record of our common stock at February 4, 2011 was 108.
Dividends
We have never paid any cash dividends on our capital stock. In addition, we are restricted from paying dividends
under our current revolving credit facility. Currently we intend to retain all future earnings for the foreseeable
future to fund development and growth of our business, retire debt obligations or buy back our common stock.
Repurchases of Common Stock
Following our Board of Directors authorization granted in December 2010, and consistent with the terms of our
credit facility, we are permitted to repurchase up to (i) $72.5 million of our common stock plus (ii) cash proceeds
received after November 20, 2007 from the exercise of stock options by our officers, directors or employees.
This authorization allowed us to repurchase up to $74.5 million of our common stock as of December 31, 2010.
Repurchased shares become a part of treasury stock.
The following table summarizes information regarding shares repurchased during the quarter ended
December 31, 2010:
Total Number of
Shares
Repurchased(1)
Average Price
Paid per Share
Total Number of Shares
Purchased as Part of
Publicly Announced
Repurchase Plans or
Programs
Maximum Approximate
Dollar Value of Shares
that May Yet be Purchased
Under the Plans or
Programs
10/1/10 - 10/31/10 ........... 0 $0 0 $20,180,851
11/1/10 - 11/30/10 ........... 0 $0 0 $24,385,472
12/1/10 - 12/31/10 ........... 0 $0 0 $74,486,073
0 $0 0 $74,486,073
20