Redbox 2010 Annual Report Download - page 43
Download and view the complete annual report
Please find page 43 of the 2010 Redbox annual report below. You can navigate through the pages in the report by either clicking on the pages listed below, or by using the keyword search tool below to find specific information within the annual report.-
 1
1 -
2
-
3
-
4
-
5
-
6
-
7
-
8
-
9
-
10
-
11
-
12
-
13
-
14
-
15
-
16
-
17
-
18
-
19
-
20
-
21
-
22
-
23
-
24
-
25
-
26
-
27
-
28
-
29
-
30
-
31
-
32
-
 33
33 -
 34
34 -
 35
35 -
 36
36 -
 37
37 -
 38
38 -
 39
39 -
 40
40 -
 41
41 -
 42
42 -
 43
43 -
 44
44 -
 45
45 -
 46
46 -
 47
47 -
 48
48 -
 49
49 -
 50
50 -
 51
51 -
 52
52 -
 53
53 -
54
-
55
-
56
-
57
-
58
-
59
-
60
-
61
-
62
-
63
-
64
-
65
-
66
-
67
-
68
-
69
-
70
-
71
-
72
-
73
-
74
-
75
-
76
-
77
-
78
-
79
-
80
-
81
-
82
-
83
-
84
-
85
-
86
-
87
-
88
-
89
-
90
-
91
-
92
-
93
-
94
-
95
-
96
-
97
-
98
-
99
-
100
-
101
-
102
-
103
-
104
-
105
-
106
 |
 |

Early Retirement of Debt
The $1.1 million charge for early retirement of debt in 2009 related to our early retirement of our $87.5 million
term loan in conjunction with the issuance of our $200 million convertible senior notes.
Income Tax Expense
Our effective tax rate from continuing operations was 39.5%, 37.1% and 29.4% in 2010, 2009 and 2008,
respectively. These rates differ from the federal statutory rate primarily due to state income taxes offset by
noncontrolling interest income attributable to non-taxpaying entities represented in the 2009 and 2008
consolidated financial statements. The increases in our effective tax rates from 2008 through 2010 were
attributable to decreases in non-controlling interests income as we purchased the remaining non-controlling
interests in Redbox.
Non-Controlling Interests
Non-controlling interest of $3.6 million and $14.4 million in 2009 and 2008, respectively, represented the
operating results, net of tax, for the 49% stake in Redbox that we did not own prior to our purchase of the
remaining non-controlling interests in Redbox in February 2009.
NON-GAAP FINANCIAL MEASURES
Non-GAAP financial measures may be provided as a complement to results in accordance with United States
generally accepted accounting principles (“GAAP”). Non-GAAP measures are not a substitute for measures
computed in accordance with GAAP. Our non-GAAP measures may be different from the presentation of
financial information by other companies.
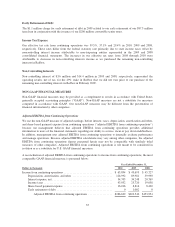
Adjusted EBITDA from Continuing Operations
We use the non-GAAP measure of adjusted earnings, before interest, taxes, depreciation, amortization and other,
and share-based payment expense from continuing operations (“adjusted EBITDA from continuing operations”)
because our management believes that adjusted EBITDA from continuing operations provides additional
information to users of the financial statements regarding our ability to service, incur or pay down indebtedness.
In addition, management uses adjusted EBITDA from continuing operations to internally evaluate performance
and manage operations. Because adjusted EBITDA calculations may vary among other companies, the adjusted
EBITDA from continuing operations figures presented herein may not be comparable with similarly titled
measures of other companies. Adjusted EBITDA from continuing operations is not meant to be considered in
isolation or as a substitute for U.S. GAAP financial measures.
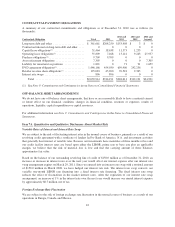
A reconciliation of adjusted EBITDA from continuing operations to income from continuing operations, the most
comparable GAAP financial measure, is presented below:
Year Ended December 31,
Dollars in thousands 2010 2009 2008
Income from continuing operations .................................. $ 65,894 $ 43,693 $ 45,727
Depreciation, amortization, and other ............................ 126,992 89,981 59,990
Interest expense, net .......................................... 34,705 34,248 20,769
Income taxes ................................................ 43,032 25,720 19,038
Share-based payment expense .................................. 16,016 8,816 8,430
Early retirement of debt ....................................... 0 1,082 0
Adjusted EBITDA from continuing operations ................. $286,639 $203,540 $153,954
35