Redbox 2010 Annual Report Download - page 44
Download and view the complete annual report
Please find page 44 of the 2010 Redbox annual report below. You can navigate through the pages in the report by either clicking on the pages listed below, or by using the keyword search tool below to find specific information within the annual report.-
 1
1 -
2
-
3
-
4
-
5
-
6
-
7
-
8
-
9
-
10
-
11
-
12
-
13
-
14
-
15
-
16
-
17
-
18
-
19
-
20
-
21
-
22
-
23
-
24
-
25
-
26
-
27
-
28
-
29
-
30
-
31
-
32
-
33
-
 34
34 -
 35
35 -
 36
36 -
 37
37 -
 38
38 -
 39
39 -
 40
40 -
 41
41 -
 42
42 -
 43
43 -
 44
44 -
 45
45 -
 46
46 -
 47
47 -
 48
48 -
 49
49 -
 50
50 -
 51
51 -
 52
52 -
 53
53 -
 54
54 -
55
-
56
-
57
-
58
-
59
-
60
-
61
-
62
-
63
-
64
-
65
-
66
-
67
-
68
-
69
-
70
-
71
-
72
-
73
-
74
-
75
-
76
-
77
-
78
-
79
-
80
-
81
-
82
-
83
-
84
-
85
-
86
-
87
-
88
-
89
-
90
-
91
-
92
-
93
-
94
-
95
-
96
-
97
-
98
-
99
-
100
-
101
-
102
-
103
-
104
-
105
-
106
 |
 |

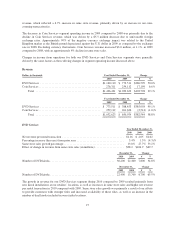
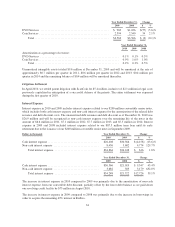
The increases in our adjusted EBITDA from continuing operations during 2010 and 2009 were primarily due to
our DVD Services segment results. The other components of adjusted EBITDA have been discussed previously
in the results of operations section above.
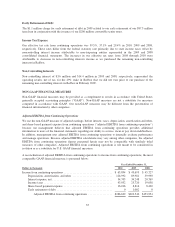
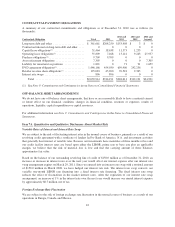
Free Cash Flow from Continuing Operations
From time to time, we use the non-GAAP financial measure free cash flow from continuing operations. The
difference between free cash flow from continuing operations and net cash provided by operating activities,
which is the most comparable GAAP financial measure, is that free cash flow from continuing operations reflects
the impact of capital expenditures. Our management believes that free cash flow from continuing operations
provides additional information to users of the financial statements regarding our ability to service, incur or pay
down indebtedness and repurchase our common stock. Free cash flow from continuing operations is not meant to
be considered in isolation or as a substitute for U.S. GAAP financial measures. The table below provides a
reconciliation of free cash flow from continuing operations to income from continuing operations:
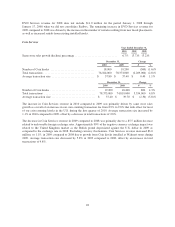
Dollars in thousands Year Ended December 31,
2010 2009 2008
Net cash provided by operating activities from continuing operations ..... $315,619 $ 123,890 $ 169,670
Purchase of property and equipment ............................... (170,847) (148,467) (144,052)
Free cash flow from continuing operations ...................... $144,772 $ (24,577) $ 25,618
An analysis of our net cash provided by operating activities and used in investing activities from continuing
operations is provided below.
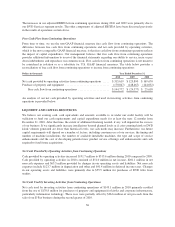
LIQUIDITY AND CAPITAL RESOURCES
We believe our existing cash, cash equivalents and amounts available to us under our credit facility will be
sufficient to fund our cash requirements and capital expenditure needs for at least the next 12 months from
December 31, 2010. After that time, the extent of additional financing needed, if any, will depend on the success
of our business. If we significantly increase installations beyond planned levels or if coin-counting kiosk or DVD
kiosk volumes generated are lower than historical levels, our cash needs may increase. Furthermore, our future
capital requirements will depend on a number of factors, including consumer use of our services, the timing and
number of machine installations, the number of available installable machines, the type and scope of service
enhancements and the cost of developing potential new product service offerings and enhancements and cash
required to fund future acquisitions.
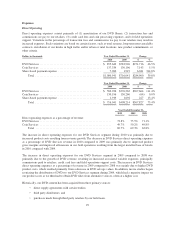
Net Cash Provided by Operating Activities from Continuing Operations
Cash provided by operating activities increased $191.7 million to $315.6 million during 2010 compared to 2009.
Cash provided by operating activities in 2010 consisted of $51.0 million in net income, $201.1 million in net
non-cash expenses and $63.5 million provided by changes in our operating assets and liabilities. Net non-cash
expenses include $123.7 million in depreciation and other and $41.4 million in deferred income taxes. Changes
in our operating assets and liabilities were primarily due to $55.5 million for purchases of DVD titles from
studios.
Net Cash Used by Investing Activities from Continuing Operations
Net cash used by investing activities from continuing operations of $143.1 million in 2010 primarily resulted
from the use of $170.8 million for purchases of property and equipment for kiosks and corporate infrastructure,
particularly information technology. These uses were partially offset by $26.6 million of net proceeds from the
sale of our E-Pay business during the second quarter of 2010.
36