Redbox 2010 Annual Report Download - page 30
Download and view the complete annual report
Please find page 30 of the 2010 Redbox annual report below. You can navigate through the pages in the report by either clicking on the pages listed below, or by using the keyword search tool below to find specific information within the annual report.-
 1
1 -
2
-
3
-
4
-
5
-
6
-
7
-
8
-
9
-
10
-
11
-
12
-
13
-
14
-
15
-
16
-
17
-
18
-
19
-
 20
20 -
 21
21 -
 22
22 -
 23
23 -
 24
24 -
 25
25 -
 26
26 -
 27
27 -
 28
28 -
 29
29 -
 30
30 -
 31
31 -
 32
32 -
 33
33 -
 34
34 -
 35
35 -
 36
36 -
 37
37 -
 38
38 -
 39
39 -
 40
40 -
41
-
42
-
43
-
44
-
45
-
46
-
47
-
48
-
49
-
50
-
51
-
52
-
53
-
54
-
55
-
56
-
57
-
58
-
59
-
60
-
61
-
62
-
63
-
64
-
65
-
66
-
67
-
68
-
69
-
70
-
71
-
72
-
73
-
74
-
75
-
76
-
77
-
78
-
79
-
80
-
81
-
82
-
83
-
84
-
85
-
86
-
87
-
88
-
89
-
90
-
91
-
92
-
93
-
94
-
95
-
96
-
97
-
98
-
99
-
100
-
101
-
102
-
103
-
104
-
105
-
106
 |
 |

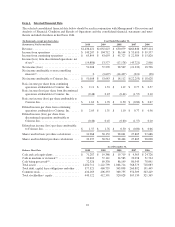
Item 6. Selected Financial Data
The selected consolidated financial data below should be read in conjunction with Management’s Discussion and
Analysis of Financial Condition and Results of Operations and the consolidated financial statements and notes
thereto included elsewhere in this Form 10-K.
(In thousands, except per share data) Year Ended December 31,
Statement of Net Income Data 2010 2009 2008 2007 2006
Revenue ................................ $1,436,421 $1,032,623 $ 650,079 $260,846 $235,414
Income from operations ................... $ 143,207 $ 104,712 $ 86,144 $ 55,610 $ 39,557
Income from continuing operations .......... $ 65,894 $ 43,693 $ 45,727 $ 22,389 $ 15,820
Income (loss) from discontinued operations, net
of tax(1) ............................... (14,886) 13,577 (17,178) (43,721) 2,906
Net income (loss) ........................ 51,008 57,270 28,549 (21,332) 18,726
Net income attributable to non-controlling
interests(2) ............................. 0 (3,627) (14,437) (921) (98)
Net income attributable to Coinstar, Inc. ...... $ 51,008 $ 53,643 $ 14,112 $ (22,253) $ 18,628
Basic income per share from continuing
operations attributable to Coinstar, Inc. ..... $ 2.11 $ 1.33 $ 1.12 $ 0.77 $ 0.57
Basic income (loss) per share from discontinued
operations attributable to Coinstar, Inc. ..... (0.48) 0.45 (0.62) (1.57) 0.10
Basic net income (loss) per share attributable to
Coinstar, Inc. .......................... $ 1.63 $ 1.78 $ 0.50 $ (0.80) $ 0.67
Diluted income per share from continuing
operations attributable to Coinstar, Inc. ..... $ 2.03 $ 1.31 $ 1.10 $ 0.77 $ 0.56
Diluted income (loss) per share from
discontinued operations attributable to
Coinstar, Inc. .......................... (0.46) 0.45 (0.60) (1.57) 0.10
Diluted net income (loss) per share attributable
to Coinstar, Inc. ........................ $ 1.57 $ 1.76 $ 0.50 $ (0.80) $ 0.66
Shares used in basic per share calculations ..... 31,268 30,152 28,041 27,805 27,686
Shares used in diluted per share calculations . . . 32,397 30,514 28,464 27,805 28,028
As of December 31,
Balance Sheet Data 2010 2009 2008 2007 2006
Cash and cash equivalents .................. $ 71,287 $ 19,386 $ 19,719 $ 9,563 $ 24,726
Cash in machine or in transit(3) .............. 39,603 57,141 34,583 70,398 51,734
Cash being processed(4) .................... 72,526 69,330 86,199 80,543 78,091
Total assets ............................. 1,282,711 1,222,799 1,066,714 768,573 718,083
Total debt, capital lease obligations and other . . 377,321 468,755 345,898 260,892 191,445
Common stock ........................... 434,169 406,333 369,735 354,509 343,229
Total stockholders’ equity .................. 443,122 412,391 320,028 305,130 321,365
22