Redbox 2010 Annual Report Download - page 37
Download and view the complete annual report
Please find page 37 of the 2010 Redbox annual report below. You can navigate through the pages in the report by either clicking on the pages listed below, or by using the keyword search tool below to find specific information within the annual report.-
 1
1 -
2
-
3
-
4
-
5
-
6
-
7
-
8
-
9
-
10
-
11
-
12
-
13
-
14
-
15
-
16
-
17
-
18
-
19
-
20
-
21
-
22
-
23
-
24
-
25
-
26
-
 27
27 -
 28
28 -
 29
29 -
 30
30 -
 31
31 -
 32
32 -
 33
33 -
 34
34 -
 35
35 -
 36
36 -
 37
37 -
 38
38 -
 39
39 -
 40
40 -
 41
41 -
 42
42 -
 43
43 -
 44
44 -
 45
45 -
 46
46 -
 47
47 -
48
-
49
-
50
-
51
-
52
-
53
-
54
-
55
-
56
-
57
-
58
-
59
-
60
-
61
-
62
-
63
-
64
-
65
-
66
-
67
-
68
-
69
-
70
-
71
-
72
-
73
-
74
-
75
-
76
-
77
-
78
-
79
-
80
-
81
-
82
-
83
-
84
-
85
-
86
-
87
-
88
-
89
-
90
-
91
-
92
-
93
-
94
-
95
-
96
-
97
-
98
-
99
-
100
-
101
-
102
-
103
-
104
-
105
-
106
 |
 |

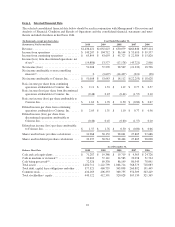
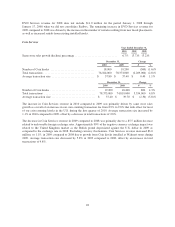
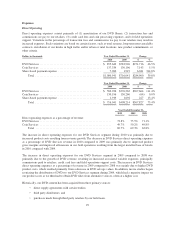
Expenses
Direct Operating
Direct operating expenses consist primarily of (1) amortization of our DVD library, (2) transaction fees and
commissions we pay to our retailers, (3) credit card fees and coin processing expenses, and (4) field operations
support. Variations in the percentage of transaction fees and commissions we pay to our retailers may result in
increased expenses. Such variations are based on certain factors, such as total revenue, long-term non-cancelable
contracts, installation of our kiosks in high traffic and/or urban or rural locations, new product commitments, or
other criteria.
Dollars in thousands Year Ended December 31, Change
2010 2009 $ %
DVD Services ........................................... $ 855,642 $583,926 $271,716 46.5%
Coin Services ........................................... 137,339 130,196 7,143 5.5%
Share-based payment expense .............................. 7,960 1,919 6,041 314.8%
Total .............................................. $1,000,941 $716,041 $284,900 39.8%
Year Ended December 31, Change
2009 2008 $ %
DVD Services ........................................... $ 583,926 $276,262 $307,664 111.4%
Coin Services ........................................... 130,196 130,260 (64) 0.0%
Share-based payment expense .............................. 1,919 1,692 227 13.4%
Total .............................................. $ 716,041 $408,214 $307,827 75.4%
Year Ended December 31,
2010 2009 2008
Direct operating expenses as a percentage of revenue:
DVD Services .................................................. 73.8% 75.5% 71.1%
Coin Services .................................................. 49.7% 50.2% 49.8%
Total ..................................................... 69.7% 69.3% 62.8%
The increase in direct operating expenses for our DVD Services segment during 2010 was primarily due to
increased product costs resulting from revenue growth. The decrease in DVD Services direct operating expenses
as a percentage of DVD Services revenue in 2010 compared to 2009 was primarily due to improved product
gross margins and improved efficiencies in our field operations resulting from the larger installed base of kiosks
in 2010 compared with 2009.
The increase in direct operating expenses for our DVD Services segment in 2009 compared to 2008 was
primarily due to the growth of DVD revenue, resulting in increased associated variable expenses, principally
commissions paid to retailers, credit card fees and field operations support costs. The increase in DVD Services
direct operating expenses as a percentage of revenue in 2009 compared to 2008 was mainly due to higher DVD
product costs, which resulted primarily from a decrease in DVD salvage values. In addition, movie studios began
restricting the distribution of DVDs to our DVD Services segment during 2009, which had a negative impact on
our product costs as we then had to obtain DVD titles from alternative sources, often at a higher cost.
Historically, our DVD content has been acquired from three primary sources:
• direct supply agreements with certain studios;
• third party distributors; and
• purchases made through third party retailers by our field team.
29