Redbox 2010 Annual Report Download - page 36
Download and view the complete annual report
Please find page 36 of the 2010 Redbox annual report below. You can navigate through the pages in the report by either clicking on the pages listed below, or by using the keyword search tool below to find specific information within the annual report.-
 1
1 -
2
-
3
-
4
-
5
-
6
-
7
-
8
-
9
-
10
-
11
-
12
-
13
-
14
-
15
-
16
-
17
-
18
-
19
-
20
-
21
-
22
-
23
-
24
-
25
-
 26
26 -
 27
27 -
 28
28 -
 29
29 -
 30
30 -
 31
31 -
 32
32 -
 33
33 -
 34
34 -
 35
35 -
 36
36 -
 37
37 -
 38
38 -
 39
39 -
 40
40 -
 41
41 -
 42
42 -
 43
43 -
 44
44 -
 45
45 -
 46
46 -
47
-
48
-
49
-
50
-
51
-
52
-
53
-
54
-
55
-
56
-
57
-
58
-
59
-
60
-
61
-
62
-
63
-
64
-
65
-
66
-
67
-
68
-
69
-
70
-
71
-
72
-
73
-
74
-
75
-
76
-
77
-
78
-
79
-
80
-
81
-
82
-
83
-
84
-
85
-
86
-
87
-
88
-
89
-
90
-
91
-
92
-
93
-
94
-
95
-
96
-
97
-
98
-
99
-
100
-
101
-
102
-
103
-
104
-
105
-
106
 |
 |

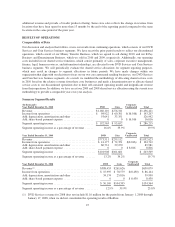
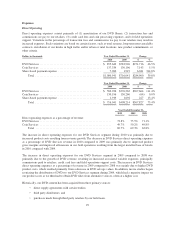
DVD Services revenue for 2008 does not include $11.0 million for the period January 1, 2008 through
January 17, 2008 when we did not consolidate Redbox. The remaining increase in DVD Services revenue for
2009 compared to 2008 was driven by the increase in the number of rentals resulting from new kiosk placements,
as well as increased rentals from existing installed kiosks.
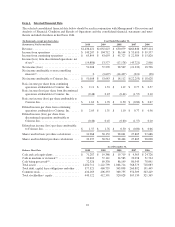
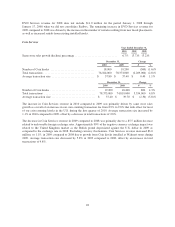
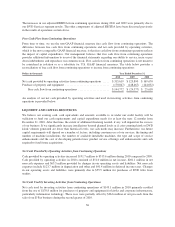
Coin Services
Year Ended December 31,
2010 2009 2008
Same store sales growth (decline) percentage .............................. 6.7% (3.7)% (3.2)%
December 31, Change
2010 2009 # %
Number of Coin kiosks ............................... 18,900 19,200 (300) (1.6)%
Total transactions .................................... 76,164,000 78,373,000 (2,209,000) (2.8)%
Average transaction size .............................. $ 37.80 $ 37.40 $ 0.40 1.1%
December 31, Change
2009 2008 # %
Number of Coin kiosks ................................ 19,200 18,400 800 4.3%
Total transactions .................................... 78,373,000 74,819,000 3,554,000 4.8%
Average transaction size ............................... $ 37.40 $ 39.70 $ (2.30) (5.8)%
The increase in Coin Services revenue in 2010 compared to 2009 was primarily driven by same store sales
growth as a result of an increase in our coin-counting transaction fee from 8.9% to 9.8% that took effect for most
of our coin-counting kiosks in the U.S. during the first quarter of 2010. Average transaction size increased by
1.1% in 2010 compared to 2009, offset by a decrease in total transactions of 2.8%.
The decrease in Coin Services revenue in 2009 compared to 2008 was primarily due to a $5.5 million decrease
related to unfavorable foreign exchange rates. Approximately 90% of the negative currency exchange impact was
related to the United Kingdom market as the British pound depreciated against the U.S. dollar in 2009 as
compared to the exchange rate in 2008. Excluding currency fluctuations, Coin Services revenue increased $3.0
million, or 1.1%, in 2009 compared to 2008 due to growth from Coin kiosks installed at Walmart stores during
2009. Average transaction size decreased by 5.8% in 2009 compared to 2008, offset by an increase in total
transactions of 4.8%.
28