Redbox 2010 Annual Report Download - page 39
Download and view the complete annual report
Please find page 39 of the 2010 Redbox annual report below. You can navigate through the pages in the report by either clicking on the pages listed below, or by using the keyword search tool below to find specific information within the annual report.-
 1
1 -
2
-
3
-
4
-
5
-
6
-
7
-
8
-
9
-
10
-
11
-
12
-
13
-
14
-
15
-
16
-
17
-
18
-
19
-
20
-
21
-
22
-
23
-
24
-
25
-
26
-
27
-
28
-
 29
29 -
 30
30 -
 31
31 -
 32
32 -
 33
33 -
 34
34 -
 35
35 -
 36
36 -
 37
37 -
 38
38 -
 39
39 -
 40
40 -
 41
41 -
 42
42 -
 43
43 -
 44
44 -
 45
45 -
 46
46 -
 47
47 -
 48
48 -
 49
49 -
50
-
51
-
52
-
53
-
54
-
55
-
56
-
57
-
58
-
59
-
60
-
61
-
62
-
63
-
64
-
65
-
66
-
67
-
68
-
69
-
70
-
71
-
72
-
73
-
74
-
75
-
76
-
77
-
78
-
79
-
80
-
81
-
82
-
83
-
84
-
85
-
86
-
87
-
88
-
89
-
90
-
91
-
92
-
93
-
94
-
95
-
96
-
97
-
98
-
99
-
100
-
101
-
102
-
103
-
104
-
105
-
106
 |
 |

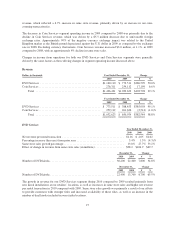
Year Ended December 31,
2010 2009 2008
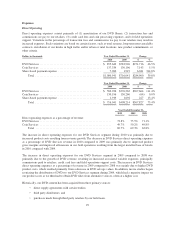
Marketing expenses as a percentage of revenue: ............................
DVD Services ....................................................... 1.3% 1.1% 1.8%
Coin Services ........................................................ 3.3% 2.8% 2.9%
Total ........................................................... 1.7% 1.5% 2.3%
The increase in marketing expenses in 2010 compared to 2009 was primarily due to increased spending in our
DVD Services segment. We introduced certain national marketing programs including radio advertising, search
engine marketing, and social media outlets for our DVD Services segment during the second quarter of 2010 and
these programs continued for the remainder of the year. In addition, we launched additional Coin Services
marketing programs including regional billboards, brand ID, and multiple media channels to reengage our
consumers in 2010 and drive sustainable demand in 2011.
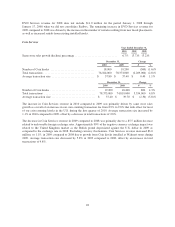
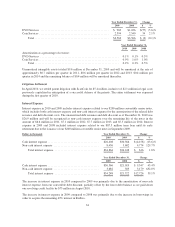
Research and Development
Our research and development expenses consist primarily of the development costs of our kiosk software,
network applications, machine improvements, and new product development. Research and development
expenses represent expenditures to support development and design of our complementary new product ideas and
to continue our ongoing efforts to enhance our existing products and services. Research and development costs
were relatively flat as a percentage of revenue in 2010 compared to 2009 and in 2009 compared to 2008.
Dollars in thousands Year Ended December 31, Change
2010 2009 $ %
Coin Services ........................................... $7,196 $5,120 $2,076 40.5%
Share-based payment expense .............................. 241 192 49 25.5%
Total .............................................. $7,437 $5,312 $2,125 40.0%
Year Ended December 31, Change
2009 2008 $ %
Coin Services ........................................... $5,120 $4,591 $ 529 11.5%
Share-based payment expense .............................. 192 167 25 15.0%
Total .............................................. $5,312 $4,758 $ 554 11.6%
Year Ended December 31,
2010 2009 2008
Research and development expenses as a percentage of revenue:
Coin Services ........................................................ 2.6% 2.0% 1.8%
Total ........................................................... 0.5% 0.5% 0.7%
31