Redbox 2010 Annual Report Download - page 88
Download and view the complete annual report
Please find page 88 of the 2010 Redbox annual report below. You can navigate through the pages in the report by either clicking on the pages listed below, or by using the keyword search tool below to find specific information within the annual report.-
 1
1 -
2
-
3
-
4
-
5
-
6
-
7
-
8
-
9
-
10
-
11
-
12
-
13
-
14
-
15
-
16
-
17
-
18
-
19
-
20
-
21
-
22
-
23
-
24
-
25
-
26
-
27
-
28
-
29
-
30
-
31
-
32
-
33
-
34
-
35
-
36
-
37
-
38
-
39
-
40
-
41
-
42
-
43
-
44
-
45
-
46
-
47
-
48
-
49
-
50
-
51
-
52
-
53
-
54
-
55
-
56
-
57
-
58
-
59
-
60
-
61
-
62
-
63
-
64
-
65
-
66
-
67
-
68
-
69
-
70
-
71
-
72
-
73
-
74
-
75
-
76
-
77
-
 78
78 -
 79
79 -
 80
80 -
 81
81 -
 82
82 -
 83
83 -
 84
84 -
 85
85 -
 86
86 -
 87
87 -
 88
88 -
 89
89 -
 90
90 -
 91
91 -
 92
92 -
 93
93 -
 94
94 -
 95
95 -
 96
96 -
 97
97 -
 98
98 -
99
-
100
-
101
-
102
-
103
-
104
-
105
-
106
 |
 |

Our business segments consist of DVD Services and Coin Services:
• DVD Services—We offer self-service DVD rentals through approximately 30,200 kiosks in 26,100
locations where consumers can rent or purchase movies. Our DVD kiosks are installed primarily at
leading grocery stores, mass merchants, drug stores, restaurants, and convenience stores. Our DVD
kiosks supply the functionality of a traditional video rental store, yet typically occupy an area of less
than ten square feet. Consumers use a touch screen to select their titles, swipe a valid credit or debit
card, and receive their movie(s). The process is designed to be fast, efficient and fully automated with
no membership fees. DVD services revenue is generated primarily through fees charged to rent movies.
In retailers with high performing DVD kiosks, we may add another kiosk to drive additional revenue
and provide a broader product offering.
• Coin Services—We offer self-service coin-counting services. We own and service all of our coin-
counting kiosks, providing a convenient and trouble-free service to retailers. We own and operate more
than 18,900 coin-counting machines in the United States, Canada, Puerto Rico, Ireland, and the United
Kingdom (approximately 12,100 of which offer a variety of stored value products to consumers). Coin-
counting revenue is generated through transaction fees from our consumers and retailers (in stored
value product transactions). Our Coin Services segment also includes our coffee kiosks and other pilot
programs.
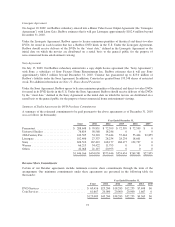
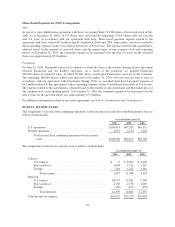
Our analysis and reconciliation of our business segment information to the consolidated financial statements that
follows covers our results from continuing operations which consists of our DVD Services and Coin Service
business segments. We have recast the prior period results to reflect our discontinued operations, which consists
of our Money Transfer Business, which we agreed to sell during 2010, and our E-Pay Business and
Entertainment Business, which we sold in 2010 and 2009, respectively. Additionally, our operating costs
included in our shared service functions, which consist primarily of sales, corporate executive management,
finance, legal, human resources, and information technology, are allocated to our DVD Services and Coin
Services business segments. We will periodically evaluate the shared service allocations for segment reporting
purposes, which may result in changes to segment allocations in future periods. We have made changes within
our organization that align with our decision to focus on our two core automated retailing businesses, our DVD
Services and Coin Services business segments. As a result, we modified the methodology of allocating shared
service costs in 2010 based on the relative revenue from these core businesses and made a determination not to
allocate shared service costs to our discontinued operations due to their self-sustained operating model and
insignificant revenue from their operations. In addition, we have recast our 2009 and 2008 shared service
allocation using the current year methodology to provide a comparable year-over-year analysis.
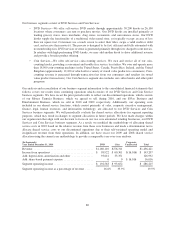
(In thousands)
Year Ended December 31, 2010 DVD Coin
Corporate
Unallocated Total
Revenue .......................................... $1,160,110 $276,311 $1,436,421
Income from operations .............................. $ 98,922 $ 60,301 $(16,016) $ 143,207
Add: depreciation, amortization and other ............... 93,641 33,351 126,992
Add: share-based payment expense ..................... 0 0 $16,016 16,016
Segment operating income ............................ $ 192,563 $ 93,652 $ 286,215
Segment operating income as a percentage of revenue ...... 16.6% 33.9% 19.9%
80