Oracle 2012 Annual Report Download - page 89
Download and view the complete annual report
Please find page 89 of the 2012 Oracle annual report below. You can navigate through the pages in the report by either clicking on the pages listed below, or by using the keyword search tool below to find specific information within the annual report.-
 1
1 -
2
-
3
-
4
-
5
-
6
-
7
-
8
-
9
-
10
-
11
-
12
-
13
-
14
-
15
-
16
-
17
-
18
-
19
-
20
-
21
-
22
-
23
-
24
-
25
-
26
-
27
-
28
-
29
-
30
-
31
-
32
-
33
-
34
-
35
-
36
-
37
-
38
-
39
-
40
-
41
-
42
-
43
-
44
-
45
-
46
-
47
-
48
-
49
-
50
-
51
-
52
-
53
-
54
-
55
-
56
-
57
-
58
-
59
-
60
-
61
-
62
-
63
-
64
-
65
-
66
-
67
-
68
-
69
-
70
-
71
-
72
-
73
-
74
-
75
-
76
-
77
-
78
-
 79
79 -
 80
80 -
 81
81 -
 82
82 -
 83
83 -
 84
84 -
 85
85 -
 86
86 -
 87
87 -
 88
88 -
 89
89 -
 90
90 -
 91
91 -
 92
92 -
 93
93 -
 94
94 -
 95
95 -
 96
96 -
 97
97 -
 98
98 -
 99
99 -
100
-
101
-
102
-
103
-
104
-
105
-
106
-
107
-
108
-
109
-
110
-
111
-
112
-
113
-
114
-
115
-
116
-
117
-
118
-
119
-
120
-
121
-
122
-
123
-
124
-
125
-
126
-
127
-
128
-
129
-
130
-
131
-
132
-
133
-
134
-
135
-
136
-
137
-
138
-
139
-
140
 |
 |

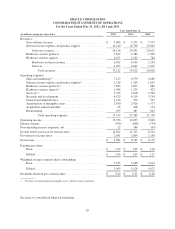
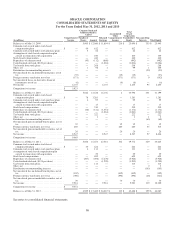
ORACLE CORPORATION
CONSOLIDATED STATEMENTS OF OPERATIONS
For the Years Ended May 31, 2012, 2011 and 2010
Year Ended May 31,
(in millions, except per share data) 2012 2011 2010
Revenues:
New software licenses .................................. $ 9,906 $ 9,235 $ 7,533
Software license updates and product support ............... 16,210 14,796 13,092
Software revenues ................................. 26,116 24,031 20,625
Hardware systems products .............................. 3,827 4,382 1,506
Hardware systems support ............................... 2,475 2,562 784
Hardware systems revenues .......................... 6,302 6,944 2,290
Services ......................................... 4,703 4,647 3,905
Total revenues ................................ 37,121 35,622 26,820
Operating expenses:
Sales and marketing(1) .................................. 7,127 6,579 5,080
Software license updates and product support(1) .............. 1,226 1,264 1,063
Hardware systems products(1) ............................ 1,843 2,057 880
Hardware systems support(1) ............................. 1,046 1,259 423
Services(1) ............................................ 3,743 3,818 3,398
Research and development .............................. 4,523 4,519 3,254
General and administrative .............................. 1,126 970 911
Amortization of intangible assets ......................... 2,430 2,428 1,973
Acquisition related and other ............................. 56 208 154
Restructuring ......................................... 295 487 622
Total operating expenses ........................ 23,415 23,589 17,758
Operating income ......................................... 13,706 12,033 9,062
Interest expense ........................................... (766) (808) (754)
Non-operating income (expense), net .......................... 22 186 (65)
Income before provision for income taxes ...................... 12,962 11,411 8,243
Provision for income taxes .................................. 2,981 2,864 2,108
Net income ............................................... $ 9,981 $ 8,547 $ 6,135
Earnings per share:
Basic ............................................... $ 1.99 $ 1.69 $ 1.22
Diluted .............................................. $ 1.96 $ 1.67 $ 1.21
Weighted average common shares outstanding:
Basic ............................................... 5,015 5,048 5,014
Diluted .............................................. 5,095 5,128 5,073
Dividends declared per common share ......................... $ 0.24 $ 0.21 $ 0.20
(1) Exclusive of amortization of intangible assets, which is shown separately.
See notes to consolidated financial statements.
85