Oracle 2012 Annual Report Download - page 71
Download and view the complete annual report
Please find page 71 of the 2012 Oracle annual report below. You can navigate through the pages in the report by either clicking on the pages listed below, or by using the keyword search tool below to find specific information within the annual report.-
 1
1 -
2
-
3
-
4
-
5
-
6
-
7
-
8
-
9
-
10
-
11
-
12
-
13
-
14
-
15
-
16
-
17
-
18
-
19
-
20
-
21
-
22
-
23
-
24
-
25
-
26
-
27
-
28
-
29
-
30
-
31
-
32
-
33
-
34
-
35
-
36
-
37
-
38
-
39
-
40
-
41
-
42
-
43
-
44
-
45
-
46
-
47
-
48
-
49
-
50
-
51
-
52
-
53
-
54
-
55
-
56
-
57
-
58
-
59
-
60
-
 61
61 -
 62
62 -
 63
63 -
 64
64 -
 65
65 -
 66
66 -
 67
67 -
 68
68 -
 69
69 -
 70
70 -
 71
71 -
 72
72 -
 73
73 -
 74
74 -
 75
75 -
 76
76 -
 77
77 -
 78
78 -
 79
79 -
 80
80 -
 81
81 -
82
-
83
-
84
-
85
-
86
-
87
-
88
-
89
-
90
-
91
-
92
-
93
-
94
-
95
-
96
-
97
-
98
-
99
-
100
-
101
-
102
-
103
-
104
-
105
-
106
-
107
-
108
-
109
-
110
-
111
-
112
-
113
-
114
-
115
-
116
-
117
-
118
-
119
-
120
-
121
-
122
-
123
-
124
-
125
-
126
-
127
-
128
-
129
-
130
-
131
-
132
-
133
-
134
-
135
-
136
-
137
-
138
-
139
-
140
 |
 |

Fiscal 2011 Compared to Fiscal 2010: On a constant currency basis, acquisition related and other expenses
increased primarily due to the full fiscal year impact of Sun’s expense contributions, including higher transitional
employee related expenses.
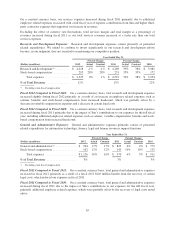
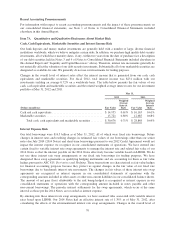
Restructuring expenses: Restructuring expenses consist of employee severance costs and may also include
charges for duplicate facilities and other contract termination costs to improve our cost structure prospectively.
For additional information regarding our restructuring plans, see Note 9 of Notes to Consolidated Financial
Statements included elsewhere in this Annual Report.
Year Ended May 31,
Percent Change Percent Change
(Dollars in millions) 2012 Actual Constant 2011 Actual Constant 2010
Restructuring expenses ................ $ 295 -40% -40% $ 487 -22% -23% $ 622
Fiscal 2012 Compared to Fiscal 2011: Restructuring expenses in fiscal 2012 primarily related to our Sun
Restructuring Plan, which our management approved, committed to and initiated in order to better align our cost
structure as a result of our acquisition of Sun. To a lesser extent, we also incurred expenses associated with other
Oracle-based plans, which our management approved, committed to and initiated in order to restructure and
further improve efficiencies in our Oracle-based operations. The decrease in restructuring expenses in fiscal 2012
in comparison to those that were incurred in fiscal 2011 primarily related to the decrease in expenses incurred in
connection with our Sun Restructuring Plan.
Fiscal 2011 Compared to Fiscal 2010: During fiscal 2011, we incurred restructuring expenses primarily in
connection with our Sun Restructuring Plan and to a lesser extent, we also incurred expenses associated with
other Oracle-based plans. During fiscal 2010, we recorded restructuring expenses primarily in connection with
our Sun Restructuring Plan and our Fiscal 2009 Oracle Restructuring Plan.
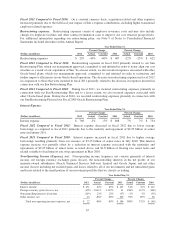
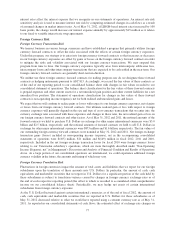
Interest Expense:
Year Ended May 31,
Percent Change Percent Change
(Dollars in millions) 2012 Actual Constant 2011 Actual Constant 2010
Interest expense ...................... $ 766 -5% -5% $ 808 7% 7% $ 754
Fiscal 2012 Compared to Fiscal 2011: Interest expense decreased in fiscal 2012 due to lower average
borrowings as compared to fiscal 2011 primarily due to the maturity and repayment of $2.25 billion of senior
notes in January 2011.
Fiscal 2011 Compared to Fiscal 2010: Interest expense increased in fiscal 2011 due to higher average
borrowings resulting primarily from our issuance of $3.25 billion of senior notes in July 2010. This interest
expense increase was partially offset by a reduction in interest expense associated with the maturities and
repayments of $2.25 billion of senior notes, as noted above, and $1.0 billion of floating rate senior notes and
related variable to fixed interest rate swap agreements in May 2010.
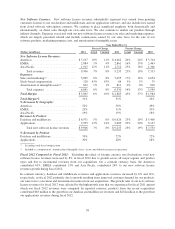
Non-Operating Income (Expense), net: Non-operating income (expense), net consists primarily of interest
income, net foreign currency exchange gains (losses), the noncontrolling interests in the net profits of our
majority-owned subsidiaries (Oracle Financial Services Software Limited and Oracle Japan) and net other
income (losses) including net realized gains and losses related to all of our investments and net unrealized gains
and losses related to the small portion of our investment portfolio that we classify as trading.
Year Ended May 31,
Percent Change Percent Change
(Dollars in millions) 2012 Actual Constant 2011 Actual Constant 2010
Interest income ................................ $ 231 42% 45% $ 163 34% 32% $ 122
Foreign currency gains (losses), net ................ (105) -1,041% -1,112% 11 108% 112% (148)
Noncontrolling interests in income ................. (119) 23% 25% (97) -2% -1% (95)
Other income, net .............................. 15 -86% -86% 109 92% 89% 56
Total non-operating income (expense), net ....... $ 22 -88% -83% $ 186 388% 372% $ (65)
67