Oracle 2012 Annual Report Download - page 65
Download and view the complete annual report
Please find page 65 of the 2012 Oracle annual report below. You can navigate through the pages in the report by either clicking on the pages listed below, or by using the keyword search tool below to find specific information within the annual report.-
 1
1 -
2
-
3
-
4
-
5
-
6
-
7
-
8
-
9
-
10
-
11
-
12
-
13
-
14
-
15
-
16
-
17
-
18
-
19
-
20
-
21
-
22
-
23
-
24
-
25
-
26
-
27
-
28
-
29
-
30
-
31
-
32
-
33
-
34
-
35
-
36
-
37
-
38
-
39
-
40
-
41
-
42
-
43
-
44
-
45
-
46
-
47
-
48
-
49
-
50
-
51
-
52
-
53
-
54
-
 55
55 -
 56
56 -
 57
57 -
 58
58 -
 59
59 -
 60
60 -
 61
61 -
 62
62 -
 63
63 -
 64
64 -
 65
65 -
 66
66 -
 67
67 -
 68
68 -
 69
69 -
 70
70 -
 71
71 -
 72
72 -
 73
73 -
 74
74 -
 75
75 -
76
-
77
-
78
-
79
-
80
-
81
-
82
-
83
-
84
-
85
-
86
-
87
-
88
-
89
-
90
-
91
-
92
-
93
-
94
-
95
-
96
-
97
-
98
-
99
-
100
-
101
-
102
-
103
-
104
-
105
-
106
-
107
-
108
-
109
-
110
-
111
-
112
-
113
-
114
-
115
-
116
-
117
-
118
-
119
-
120
-
121
-
122
-
123
-
124
-
125
-
126
-
127
-
128
-
129
-
130
-
131
-
132
-
133
-
134
-
135
-
136
-
137
-
138
-
139
-
140
 |
 |

Excluding the effect of currency rate fluctuations, total software license updates and product support margin and margin
as a percentage of total revenues increased as our total revenues increased while our total expenses remained flat.
Fiscal 2011 Compared to Fiscal 2010: Excluding the effect of currency rate fluctuations, software license
updates and product support revenues increased in fiscal 2011 for similar reasons as those noted above.
In reported currency, software license updates and product support revenues in fiscal 2011 included incremental
revenues of $240 million from Sun through the third quarter of fiscal 2011 (the one year anniversary of our
acquisition) and $80 million from our other recently acquired companies. As described above, the amounts of
software license updates and product support revenues that we recognized in fiscal 2011 and fiscal 2010 were
affected by business combination accounting rules.
On a constant currency basis, total software license updates and product support expenses increased due to an
increase in salaries, variable compensation and benefits expenses that were primarily related to a full year’s
contribution from Sun and certain other headcount increases.
Excluding the effect of currency rate fluctuations, total software license updates and product support margin and margin
as a percentage of total revenues increased as our total revenues increased at a faster rate than our total expenses.
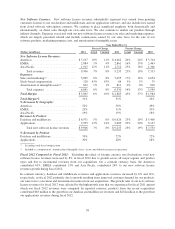
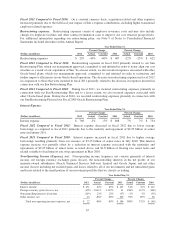
Hardware Systems Business
Our hardware systems business consists of our hardware systems products segment and hardware systems
support segment.
Hardware Systems Products: Hardware systems products revenues are primarily generated from the sales of our
computer server and storage products. We market and sell our hardware systems products through our direct sales
force and indirect channels such as independent distributors and value added resellers. Operating expenses associated
with our hardware systems products include the cost of hardware systems products, which consists of expenses for
materials and labor used to produce these products by our internal manufacturing operations or by third party
manufacturers, warranty expenses and the impact of periodic changes in inventory valuation, including the impact of
inventory determined to be excess and obsolete. Operating expenses associated with our hardware systems products
also include sales and marketing expenses, which are largely personnel related and include variable compensation
earned by our sales force for the sales of our hardware products, and amortization of intangible assets.
Year Ended May 31,
Percent Change Percent Change
(Dollars in millions) 2012 Actual Constant 2011 Actual Constant 2010
Hardware Systems Products Revenues:
Americas ............................. $ 1,880 -16% -16% $ 2,248 201% 199% $ 747
EMEA ............................... 1,140 -15% -16% 1,337 176% 165% 485
Asia Pacific ........................... 807 1% -3% 797 191% 173% 274
Total revenues ..................... 3,827 -13% -14% 4,382 191% 184% 1,506
Expenses:
Hardware systems products(1) ............. 1,842 -10% -10% 2,055 134% 126% 877
Sales and marketing(1) ................... 1,106 7% 6% 1,037 203% 194% 342
Stock-based compensation ............... 3 -57% -57% 5 4% 4% 5
Amortization of intangible assets(2) ........ 393 -8% -8% 426 164% 164% 162
Total expenses ..................... 3,344 -5% -5% 3,523 154% 146% 1,386
Total Margin ......................... $ 483 -44% -46% $ 859 634% 732% $ 120
Total Margin % ....................... 13% 20% 8%
% Revenues by Geography:
Americas ............................. 49% 51% 50%
EMEA ............................... 30% 31% 32%
Asia Pacific ........................... 21% 18% 18%
(1) Excluding stock-based compensation
(2) Included as a component of ‘Amortization of Intangible Assets’ in our consolidated statements of operations
61