Oracle 2012 Annual Report Download - page 74
Download and view the complete annual report
Please find page 74 of the 2012 Oracle annual report below. You can navigate through the pages in the report by either clicking on the pages listed below, or by using the keyword search tool below to find specific information within the annual report.-
 1
1 -
2
-
3
-
4
-
5
-
6
-
7
-
8
-
9
-
10
-
11
-
12
-
13
-
14
-
15
-
16
-
17
-
18
-
19
-
20
-
21
-
22
-
23
-
24
-
25
-
26
-
27
-
28
-
29
-
30
-
31
-
32
-
33
-
34
-
35
-
36
-
37
-
38
-
39
-
40
-
41
-
42
-
43
-
44
-
45
-
46
-
47
-
48
-
49
-
50
-
51
-
52
-
53
-
54
-
55
-
56
-
57
-
58
-
59
-
60
-
61
-
62
-
63
-
 64
64 -
 65
65 -
 66
66 -
 67
67 -
 68
68 -
 69
69 -
 70
70 -
 71
71 -
 72
72 -
 73
73 -
 74
74 -
 75
75 -
 76
76 -
 77
77 -
 78
78 -
 79
79 -
 80
80 -
 81
81 -
 82
82 -
 83
83 -
 84
84 -
85
-
86
-
87
-
88
-
89
-
90
-
91
-
92
-
93
-
94
-
95
-
96
-
97
-
98
-
99
-
100
-
101
-
102
-
103
-
104
-
105
-
106
-
107
-
108
-
109
-
110
-
111
-
112
-
113
-
114
-
115
-
116
-
117
-
118
-
119
-
120
-
121
-
122
-
123
-
124
-
125
-
126
-
127
-
128
-
129
-
130
-
131
-
132
-
133
-
134
-
135
-
136
-
137
-
138
-
139
-
140
 |
 |
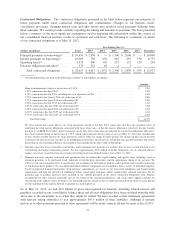
Cash flows from operating activities: Our largest source of operating cash flows is cash collections from our
customers following the purchase and renewal of their software license updates and product support agreements.
Payments from customers for these support agreements are generally received near the beginning of the
contracts’ terms, which are generally one year in length. We also generate significant cash from new software
license sales, sales of hardware systems products and hardware systems support arrangements and, to a lesser
extent, services. Our primary uses of cash from operating activities are for employee related expenditures,
material and manufacturing costs related to the production of our hardware systems products, taxes and leased
facilities.
Fiscal 2012 Compared to Fiscal 2011: Net cash provided by operating activities increased in fiscal 2012
primarily due to increased net income adjusted for amortization of intangible assets, stock-based compensation
and depreciation, an increase in cash from the collection of trade receivables, an increase in cash received that
relates to our deferred revenue balances, a decrease in cash used to pay income tax obligations and certain other
net cash favorable working capital movements, in each case compared to fiscal 2011. These cash favorable
movements were partially offset by an increase in cash used to pay compensation liabilities in fiscal 2012 such as
commissions and bonuses in comparison to fiscal 2011.
Fiscal 2011 Compared to Fiscal 2010: Net cash provided by operating activities increased in fiscal 2011
primarily due to higher net income adjusted for amortization of intangible assets, stock-based compensation and
depreciation. These fiscal 2011 increases were partially offset by certain unfavorable changes in working capital,
primarily increases in net trade receivables resulting from increases in revenues during our fiscal fourth quarter
of 2011 in comparison to fiscal 2010.
Cash flows from investing activities: The changes in cash flows from investing activities primarily relate to
acquisitions and the timing of purchases, maturities and sales of our investments in marketable debt securities.
We also use cash to invest in capital and other assets to support our growth.
Fiscal 2012 Compared to Fiscal 2011: Net cash used for investing activities increased in fiscal 2012 due to an
increase in cash used for acquisitions, net of cash acquired, and an increase in capital expenditures, partially
offset by a decrease in net cash used to purchase marketable securities (net of proceeds received from sales and
maturities).
Fiscal 2011 Compared to Fiscal 2010: Net cash used for investing activities decreased in fiscal 2011 due to a
decrease in cash used for acquisitions, net of cash acquired, and a decrease in cash used to purchase marketable
securities (net of proceeds received from sales and maturities), partially offset by an increase in net capital
expenditures.
Cash flows from financing activities: The changes in cash flows from financing activities primarily relate to
borrowings and payments under debt facilities as well as stock repurchases, dividend payments and proceeds
from stock option exercises.
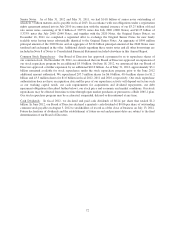
Fiscal 2012 Compared to Fiscal 2011: We used net cash for financing activities in fiscal 2012 of $6.1 billion in
comparison to net cash provided by financing activities in fiscal 2011 of $516 million primarily due to our
increase in common stock repurchases in fiscal 2012 (see discussion in “Working Capital” above and Note 13 of
Notes to Consolidated Financial Statements included elsewhere in this Annual Report for additional
information), a reduction in the amount of debt that we issued in fiscal 2012 ($1.7 billion of short-term
borrowings pursuant to a revolving credit facility in May 2012 in comparison to $3.25 billion of long-term senior
notes in July 2010 and $1.15 billion of borrowings pursuant to revolving credit facilities in May 2011), and a
decrease in proceeds from stock option exercises during fiscal 2012, in each case in comparison to fiscal 2011.
These unfavorable impacts to our financing cash flows during fiscal 2012 were partially offset by a decrease in
cash used for debt related repayments during fiscal 2012 ($1.15 billion of short-term borrowings pursuant to our
revolving credit facilities and $255 million of RightNow’s legacy convertible notes were repaid in February 2012
in comparison to fiscal 2011 repayments of $2.25 billion of senior notes and $881 million of commercial paper
notes).
70