Oracle 2012 Annual Report Download - page 128
Download and view the complete annual report
Please find page 128 of the 2012 Oracle annual report below. You can navigate through the pages in the report by either clicking on the pages listed below, or by using the keyword search tool below to find specific information within the annual report.-
 1
1 -
2
-
3
-
4
-
5
-
6
-
7
-
8
-
9
-
10
-
11
-
12
-
13
-
14
-
15
-
16
-
17
-
18
-
19
-
20
-
21
-
22
-
23
-
24
-
25
-
26
-
27
-
28
-
29
-
30
-
31
-
32
-
33
-
34
-
35
-
36
-
37
-
38
-
39
-
40
-
41
-
42
-
43
-
44
-
45
-
46
-
47
-
48
-
49
-
50
-
51
-
52
-
53
-
54
-
55
-
56
-
57
-
58
-
59
-
60
-
61
-
62
-
63
-
64
-
65
-
66
-
67
-
68
-
69
-
70
-
71
-
72
-
73
-
74
-
75
-
76
-
77
-
78
-
79
-
80
-
81
-
82
-
83
-
84
-
85
-
86
-
87
-
88
-
89
-
90
-
91
-
92
-
93
-
94
-
95
-
96
-
97
-
98
-
99
-
100
-
101
-
102
-
103
-
104
-
105
-
106
-
107
-
108
-
109
-
110
-
111
-
112
-
113
-
114
-
115
-
116
-
117
-
 118
118 -
 119
119 -
 120
120 -
 121
121 -
 122
122 -
 123
123 -
 124
124 -
 125
125 -
 126
126 -
 127
127 -
 128
128 -
 129
129 -
 130
130 -
 131
131 -
 132
132 -
 133
133 -
 134
134 -
 135
135 -
 136
136 -
 137
137 -
 138
138 -
139
-
140
 |
 |

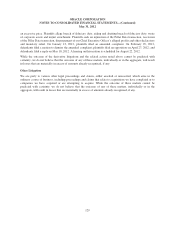
ORACLE CORPORATION
NOTES TO CONSOLIDATED FINANCIAL STATEMENTS—(Continued)
May 31, 2012
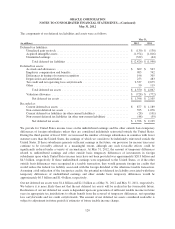
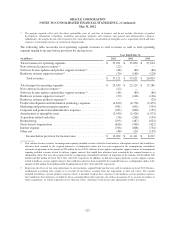
The following table presents summary results for each of our three businesses and for the operating segments of
our software and hardware systems businesses:
Year Ended May 31,
(in millions) 2012 2011 2010
New software licenses:
Revenues(1) .................................................. $ 9,910 $ 9,220 $ 7,525
Sales and distribution expenses ................................... 5,107 4,692 3,980
Margin(2) .................................................... $ 4,803 $ 4,528 $ 3,545
Software license updates and product support:
Revenues(1) .................................................. $ 16,258 $ 14,876 $ 13,175
Software license update and product support expenses ................ 1,116 1,144 958
Margin(2) .................................................... $ 15,142 $ 13,732 $ 12,217
Total software business:
Revenues(1) ................................................ $ 26,168 $ 24,096 $ 20,700
Expenses .................................................. 6,223 5,836 4,938
Margin(2) .................................................. $ 19,945 $ 18,260 $ 15,762
Hardware systems products:
Revenues .................................................... $ 3,827 $ 4,382 $ 1,493
Hardware systems products expenses .............................. 1,841 2,061 850
Sales and distribution expenses ................................... 1,050 960 307
Margin(2) .................................................... $ 936 $ 1,361 $ 336
Hardware systems support:
Revenues(1) .................................................. $ 2,505 $ 2,710 $ 912
Hardware systems support expenses ............................... 1,006 1,221 408
Margin(2) .................................................... $ 1,499 $ 1,489 $ 504
Total hardware systems business:
Revenues(1) ................................................ $ 6,332 $ 7,092 $ 2,405
Expenses .................................................. 3,897 4,242 1,565
Margin(2) .................................................. $ 2,435 $ 2,850 $ 840
Total services business:
Revenues(1) ................................................ $ 4,721 $ 4,662 $ 3,929
Services expenses ........................................... 3,662 3,643 3,245
Margin(2) .................................................. $ 1,059 $ 1,019 $ 684
Totals:
Revenues(1) ............................................ $ 37,221 $ 35,850 $ 27,034
Expenses .............................................. 13,782 13,721 9,748
Margin(2) .............................................. $ 23,439 $ 22,129 $ 17,286
(1) Operating segment revenues generally differ from the external reporting classifications due to certain software license products that are
classified as service revenues for management reporting purposes. New software licenses revenues for management reporting included
revenues related to cloud software subscription contracts that would have otherwise been recorded by the acquired businesses as
independent entities but were not recognized in the accompanying consolidated statements of operations in the amount of $22 million for
fiscal 2012. Software license updates and product support revenues for management reporting included revenues related to software
support contracts that would have otherwise been recorded by the acquired businesses as independent entities but were not recognized in
the accompanying consolidated statements of operations in the amounts of $48 million, $80 million and $86 million for fiscal 2012, 2011
and 2010, respectively. In addition, we did not recognize hardware systems support revenues related to hardware systems support
contracts that would have otherwise been recorded by the acquired businesses as independent entities in the amounts of $30 million,
$148 million and $128 million for fiscal 2012, 2011 and 2010, respectively. See Note 10 for an explanation of these adjustments and the
table below for a reconciliation of our total operating segment revenues to our total revenues.
124