Oracle 2012 Annual Report Download - page 121
Download and view the complete annual report
Please find page 121 of the 2012 Oracle annual report below. You can navigate through the pages in the report by either clicking on the pages listed below, or by using the keyword search tool below to find specific information within the annual report.-
 1
1 -
2
-
3
-
4
-
5
-
6
-
7
-
8
-
9
-
10
-
11
-
12
-
13
-
14
-
15
-
16
-
17
-
18
-
19
-
20
-
21
-
22
-
23
-
24
-
25
-
26
-
27
-
28
-
29
-
30
-
31
-
32
-
33
-
34
-
35
-
36
-
37
-
38
-
39
-
40
-
41
-
42
-
43
-
44
-
45
-
46
-
47
-
48
-
49
-
50
-
51
-
52
-
53
-
54
-
55
-
56
-
57
-
58
-
59
-
60
-
61
-
62
-
63
-
64
-
65
-
66
-
67
-
68
-
69
-
70
-
71
-
72
-
73
-
74
-
75
-
76
-
77
-
78
-
79
-
80
-
81
-
82
-
83
-
84
-
85
-
86
-
87
-
88
-
89
-
90
-
91
-
92
-
93
-
94
-
95
-
96
-
97
-
98
-
99
-
100
-
101
-
102
-
103
-
104
-
105
-
106
-
107
-
108
-
109
-
110
-
 111
111 -
 112
112 -
 113
113 -
 114
114 -
 115
115 -
 116
116 -
 117
117 -
 118
118 -
 119
119 -
 120
120 -
 121
121 -
 122
122 -
 123
123 -
 124
124 -
 125
125 -
 126
126 -
 127
127 -
 128
128 -
 129
129 -
 130
130 -
 131
131 -
132
-
133
-
134
-
135
-
136
-
137
-
138
-
139
-
140
 |
 |

ORACLE CORPORATION
NOTES TO CONSOLIDATED FINANCIAL STATEMENTS—(Continued)
May 31, 2012
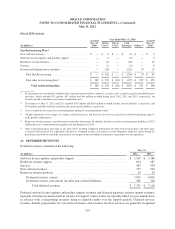
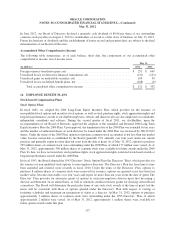
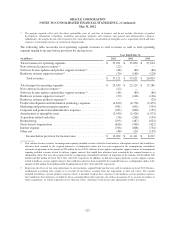
Stock-Based Compensation Expense and Valuation of Stock Options
Stock-based compensation is included in the following operating expense line items in our consolidated
statements of operations:
Year Ended May 31,
(in millions) 2012 2011 2010
Sales and marketing .............................................. $ 122 $ 87 $ 81
Software license updates and product support .......................... 18 14 17
Hardware systems products ........................................ 1 2 3
Hardware systems support ......................................... 5 5 2
Services ....................................................... 23 16 14
Research and development ......................................... 295 231 172
General and administrative ........................................ 162 145 132
Acquisition related and other ....................................... 33 10 15
Total stock-based compensation ................................ 659 510 436
Estimated income tax benefit included in provision for income taxes ....... (216) (170) (146)
Total stock-based compensation, net of estimated income tax benefit . . . $ 443 $ 340 $ 290
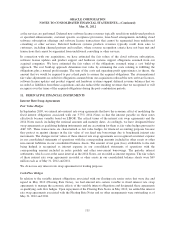
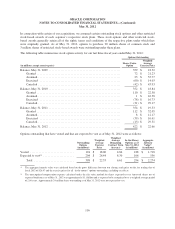
We estimate the fair values of our share-based payments using the Black-Scholes-Merton option-pricing model,
which was developed for use in estimating the fair values of stock options. Option valuation models, including
the Black-Scholes-Merton option-pricing model, require the input of assumptions, including stock price
volatility. Changes in the input assumptions can materially affect the fair value estimates and ultimately how
much we recognize as stock-based compensation expense. The fair values of our stock options were estimated at
the date of grant or date of acquisition for options and restricted stock-based awards assumed in a business
combination. The weighted average input assumptions used and resulting fair values of our stock options were as
follows for fiscal 2012, 2011 and 2010:
Year Ended May 31,
2012 2011 2010
Expected life (in years) ........................................... 5.1 5.1 4.7
Risk-free interest rate ............................................. 1.6% 1.8% 2.1%
Volatility ....................................................... 30% 33% 31%
Dividend yield .................................................. 0.8% 0.9% 0.9%
Weighted-average fair value per share ................................ $ 9.30 $ 6.61 $ 5.21
The expected life input is based on historical exercise patterns and post-vesting termination behavior, the risk-
free interest rate input is based on United States Treasury instruments, the annualized dividend yield input is
based on the per share dividend declared by our Board of Directors and the volatility input is calculated based on
the implied volatility of our publicly traded options.
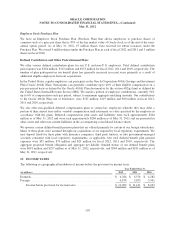
Tax Benefits from Exercise of Stock Options and Vesting of Restricted Stock-Based Awards
Total cash received as a result of option exercises was approximately $622 million, $1.3 billion and $812 million
for fiscal 2012, 2011 and 2010, respectively. The aggregate intrinsic value of options exercised and vesting of
restricted stock-based awards was $587 million, $1.1 billion and $647 million for fiscal 2012, 2011 and 2010,
respectively. In connection with these exercises and vesting of restricted stock-based awards, the tax benefits
realized by us were $182 million, $325 million and $203 million for fiscal 2012, 2011 and 2010, respectively. Of
the total tax benefits received, we classified excess tax benefits from stock-based compensation of $97 million,
$215 million and $110 million as cash flows from financing activities rather than cash flows from operating
activities for fiscal 2012, 2011 and 2010, respectively.
117