Oracle 2012 Annual Report Download - page 120
Download and view the complete annual report
Please find page 120 of the 2012 Oracle annual report below. You can navigate through the pages in the report by either clicking on the pages listed below, or by using the keyword search tool below to find specific information within the annual report.-
 1
1 -
2
-
3
-
4
-
5
-
6
-
7
-
8
-
9
-
10
-
11
-
12
-
13
-
14
-
15
-
16
-
17
-
18
-
19
-
20
-
21
-
22
-
23
-
24
-
25
-
26
-
27
-
28
-
29
-
30
-
31
-
32
-
33
-
34
-
35
-
36
-
37
-
38
-
39
-
40
-
41
-
42
-
43
-
44
-
45
-
46
-
47
-
48
-
49
-
50
-
51
-
52
-
53
-
54
-
55
-
56
-
57
-
58
-
59
-
60
-
61
-
62
-
63
-
64
-
65
-
66
-
67
-
68
-
69
-
70
-
71
-
72
-
73
-
74
-
75
-
76
-
77
-
78
-
79
-
80
-
81
-
82
-
83
-
84
-
85
-
86
-
87
-
88
-
89
-
90
-
91
-
92
-
93
-
94
-
95
-
96
-
97
-
98
-
99
-
100
-
101
-
102
-
103
-
104
-
105
-
106
-
107
-
108
-
109
-
 110
110 -
 111
111 -
 112
112 -
 113
113 -
 114
114 -
 115
115 -
 116
116 -
 117
117 -
 118
118 -
 119
119 -
 120
120 -
 121
121 -
 122
122 -
 123
123 -
 124
124 -
 125
125 -
 126
126 -
 127
127 -
 128
128 -
 129
129 -
 130
130 -
131
-
132
-
133
-
134
-
135
-
136
-
137
-
138
-
139
-
140
 |
 |

ORACLE CORPORATION
NOTES TO CONSOLIDATED FINANCIAL STATEMENTS—(Continued)
May 31, 2012
In connection with certain of our acquisitions, we assumed certain outstanding stock options and other restricted
stock-based awards of each acquiree’s respective stock plans. These stock options and other restricted stock-
based awards generally retain all of the rights, terms and conditions of the respective plans under which they
were originally granted. As of May 31, 2012, options to purchase 20 million shares of common stock and
3 million shares of restricted stock-based awards were outstanding under these plans.
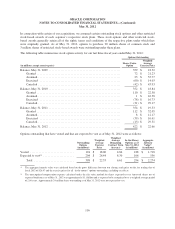
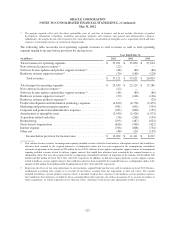
The following table summarizes stock option activity for our last three fiscal years ended May 31, 2012:
Options Outstanding
Weighted
Shares Under Average
(in millions, except exercise price) Option Exercise Price
Balance, May 31, 2009 ................................................. 359 $ 18.32
Granted ......................................................... 72 $ 21.23
Assumed ........................................................ 23 $ 55.77
Exercised ....................................................... (60) $ 14.03
Canceled ........................................................ (42) $ 43.93
Balance, May 31, 2010 ................................................. 352 $ 18.84
Granted ......................................................... 110 $ 22.58
Assumed ........................................................ 1 $ 16.38
Exercised ....................................................... (78) $ 16.73
Canceled ........................................................ (31) $ 29.17
Balance, May 31, 2011 ................................................. 354 $ 19.53
Granted ......................................................... 112 $ 32.05
Assumed ........................................................ 8 $ 12.17
Exercised ....................................................... (39) $ 16.61
Canceled ........................................................ (13) $ 29.31
Balance, May 31, 2012 ................................................. 422 $ 22.66
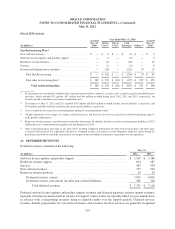
Options outstanding that have vested and that are expected to vest as of May 31, 2012 were as follows:
Weighted
Weighted Average In-the-Money Aggregate
Outstanding Average Remaining Options as of Intrinsic
Options Exercise Contract Term May 31, 2012 Value(1)
(in millions) Price (in years) (in millions) (in millions)
Vested .............................. 194 $ 18.00 4.84 188 $ 1,718
Expected to vest(2) ..................... 204 $ 26.44 8.30 106 556
Total ........................... 398 $ 22.33 6.61 294 $ 2,274
(1) The aggregate intrinsic value was calculated based on the gross difference between our closing stock price on the last trading day of
fiscal 2012 of $26.47 and the exercise prices for all “in-the-money” options outstanding, excluding tax effects.
(2) The unrecognized compensation expense calculated under the fair value method for shares expected to vest (unvested shares net of
expected forfeitures) as of May 31, 2012 was approximately $1.1 billion and is expected to be recognized over a weighted average period
of 2.66 years. Approximately 24 million shares outstanding as of May 31, 2012 were not expected to vest.
116