Oracle 2012 Annual Report Download - page 66
Download and view the complete annual report
Please find page 66 of the 2012 Oracle annual report below. You can navigate through the pages in the report by either clicking on the pages listed below, or by using the keyword search tool below to find specific information within the annual report.-
 1
1 -
2
-
3
-
4
-
5
-
6
-
7
-
8
-
9
-
10
-
11
-
12
-
13
-
14
-
15
-
16
-
17
-
18
-
19
-
20
-
21
-
22
-
23
-
24
-
25
-
26
-
27
-
28
-
29
-
30
-
31
-
32
-
33
-
34
-
35
-
36
-
37
-
38
-
39
-
40
-
41
-
42
-
43
-
44
-
45
-
46
-
47
-
48
-
49
-
50
-
51
-
52
-
53
-
54
-
55
-
 56
56 -
 57
57 -
 58
58 -
 59
59 -
 60
60 -
 61
61 -
 62
62 -
 63
63 -
 64
64 -
 65
65 -
 66
66 -
 67
67 -
 68
68 -
 69
69 -
 70
70 -
 71
71 -
 72
72 -
 73
73 -
 74
74 -
 75
75 -
 76
76 -
77
-
78
-
79
-
80
-
81
-
82
-
83
-
84
-
85
-
86
-
87
-
88
-
89
-
90
-
91
-
92
-
93
-
94
-
95
-
96
-
97
-
98
-
99
-
100
-
101
-
102
-
103
-
104
-
105
-
106
-
107
-
108
-
109
-
110
-
111
-
112
-
113
-
114
-
115
-
116
-
117
-
118
-
119
-
120
-
121
-
122
-
123
-
124
-
125
-
126
-
127
-
128
-
129
-
130
-
131
-
132
-
133
-
134
-
135
-
136
-
137
-
138
-
139
-
140
 |
 |

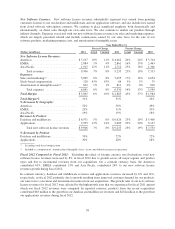
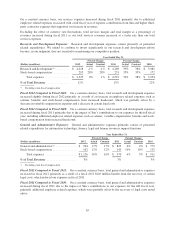
Fiscal 2012 Compared to Fiscal 2011: Excluding the effects of currency rate fluctuations, hardware systems
products revenues decreased in fiscal 2012 due to reductions in sales volumes of certain of our legacy product lines,
including lower margin products, and due to the recent introduction of new SPARC processor-based servers that we
believe slowed purchases of predecessor server products. These hardware revenue decreases were partially offset by
increases in hardware revenues attributable to our Oracle Engineered Systems during fiscal 2012.
Excluding the effects of currency rate fluctuations, total hardware systems products operating expenses declined
in fiscal 2012 primarily due to reductions in hardware systems products costs associated with lower revenues,
lower intangible asset amortization, and decreases in bad debt expenses, which were partially offset by increased
employee related expenses due to additional sales headcount.
Excluding the effect of currency rate fluctuations, total hardware systems products margin and total margin as a
percentage of revenues decreased in fiscal 2012 primarily due to decreases in hardware systems products
revenues and increases in hardware sales and marketing expenses.
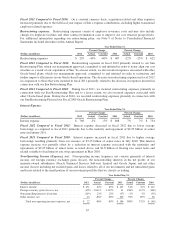
Fiscal 2011 Compared to Fiscal 2010: The increases in hardware systems products revenues, expenses and
total margin for fiscal 2011 were primarily attributable to the impact of Sun’s contributions to our operating
results for the full fiscal 2011 year as compared to fiscal 2010, which included Sun’s contribution to our
operating results for only a portion of the fiscal year. In fiscal 2010, our hardware systems products expenses and
total margin were unfavorably impacted by $29 million of fair value adjustments made pursuant to business
combination accounting rules for inventories we assumed from Sun and sold to customers in the post-
combination periods. Excluding the effect of currency rate fluctuations, total hardware systems products margin
and margin as a percentage of total revenues increased as our total revenues increased at a faster rate than our
total expenses.
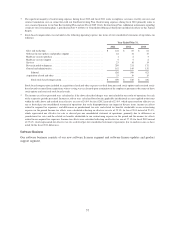
Hardware Systems Support: Our hardware systems support offerings provide customers with software updates
for the software components that are essential to the functionality of our hardware systems and can include
product repairs, maintenance services and technical support services. Expenses associated with our hardware
systems support operating segment include the cost of materials used to repair customer products, the cost of
providing support services, largely personnel related expenses, and the amortization of our intangible assets
associated with hardware systems support contracts and customer relationships obtained from our acquisitions.
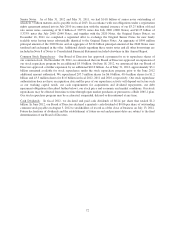
Year Ended May 31,
Percent Change Percent Change
(Dollars in millions) 2012 Actual Constant 2011 Actual Constant 2010
Hardware Systems Support Revenues:
Americas .............................. $ 1,157 5% 5% $ 1,103 267% 263% $ 301
EMEA ................................ 870 -13% -14% 1,004 195% 186% 340
Asia Pacific ............................ 448 -2% -5% 455 217% 196% 143
Total revenues ...................... 2,475 -3% -4% 2,562 227% 218% 784
Expenses:
Hardware systems support(1) ............... 1,041 -17% -18% 1,254 198% 189% 421
Stock-based compensation ................ 5 1% 1% 5 124% 124% 2
Amortization of intangible assets(2) ......... 305 2% 2% 298 202% 202% 98
Total expenses ..................... 1,351 -13% -14% 1,557 199% 191% 521
Total Margin .......................... $ 1,124 12% 10% $ 1,005 283% 274% $ 263
Total Margin % ........................ 45% 39% 34%
% Revenues by Geography:
Americas .............................. 47% 43% 38%
EMEA ................................ 35% 39% 43%
Asia Pacific ............................ 18% 18% 19%
(1) Excluding stock-based compensation
(2) Included as a component of ‘Amortization of Intangible Assets’ in our consolidated statements of operations
62