Oracle 2012 Annual Report Download - page 58
Download and view the complete annual report
Please find page 58 of the 2012 Oracle annual report below. You can navigate through the pages in the report by either clicking on the pages listed below, or by using the keyword search tool below to find specific information within the annual report.-
 1
1 -
2
-
3
-
4
-
5
-
6
-
7
-
8
-
9
-
10
-
11
-
12
-
13
-
14
-
15
-
16
-
17
-
18
-
19
-
20
-
21
-
22
-
23
-
24
-
25
-
26
-
27
-
28
-
29
-
30
-
31
-
32
-
33
-
34
-
35
-
36
-
37
-
38
-
39
-
40
-
41
-
42
-
43
-
44
-
45
-
46
-
47
-
 48
48 -
 49
49 -
 50
50 -
 51
51 -
 52
52 -
 53
53 -
 54
54 -
 55
55 -
 56
56 -
 57
57 -
 58
58 -
 59
59 -
 60
60 -
 61
61 -
 62
62 -
 63
63 -
 64
64 -
 65
65 -
 66
66 -
 67
67 -
 68
68 -
69
-
70
-
71
-
72
-
73
-
74
-
75
-
76
-
77
-
78
-
79
-
80
-
81
-
82
-
83
-
84
-
85
-
86
-
87
-
88
-
89
-
90
-
91
-
92
-
93
-
94
-
95
-
96
-
97
-
98
-
99
-
100
-
101
-
102
-
103
-
104
-
105
-
106
-
107
-
108
-
109
-
110
-
111
-
112
-
113
-
114
-
115
-
116
-
117
-
118
-
119
-
120
-
121
-
122
-
123
-
124
-
125
-
126
-
127
-
128
-
129
-
130
-
131
-
132
-
133
-
134
-
135
-
136
-
137
-
138
-
139
-
140
 |
 |

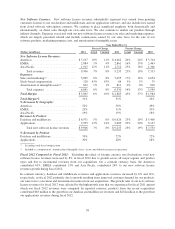
Constant Currency Presentation
Our international operations have provided and will continue to provide a significant portion of our total
revenues and expenses. As a result, total revenues and expenses will continue to be affected by changes in the
U.S. Dollar against major international currencies. In order to provide a framework for assessing how our
underlying businesses performed excluding the effect of foreign currency fluctuations, we compare the percent
change in the results from one period to another period in this Annual Report using constant currency disclosure.
To present this information, current and comparative prior period results for entities reporting in currencies other
than U.S. Dollars are converted into U.S. Dollars at constant exchange rates (i.e. the rates in effect on May 31,
2011, which was the last day of our prior fiscal year) rather than the actual exchange rates in effect during the
respective periods. For example, if an entity reporting in Euros had revenues of 1.0 million Euros from products
sold on May 31, 2012 and May 31, 2011, our financial statements would reflect reported revenues of $1.25
million in fiscal 2012 (using 1.25 as the month-end average exchange rate for the period) and $1.41 million in
fiscal 2011 (using 1.41 as the month-end average exchange rate for the period). The constant currency
presentation would translate the fiscal 2012 results using the fiscal 2011 exchange rate and indicate, in this
example, no change in revenues during the period. In each of the tables below, we present the percent change
based on actual, unrounded results in reported currency and in constant currency.
Total Revenues and Operating Expenses
Year Ended May 31,
Percent Change Percent Change
(Dollars in millions) 2012 Actual Constant 2011 Actual Constant 2010
Total Revenues by Geography:
Americas .......................... $19,236 5% 5% $ 18,352 33% 32% $ 13,819
EMEA(1) ........................... 11,561 1% 1% 11,497 29% 28% 8,938
Asia Pacific(2) ....................... 6,324 10% 7% 5,773 42% 32% 4,063
Total revenues .................. 37,121 4% 4% 35,622 33% 30% 26,820
Total Operating Expenses ............. 23,415 -1% -1% 23,589 33% 31% 17,758
Total Operating Margin .............. $13,706 14% 14% $ 12,033 33% 29% $ 9,062
Total Operating Margin % ............ 37% 34% 34%
% Revenues by Geography:
Americas .......................... 52% 52% 52%
EMEA ............................ 31% 32% 33%
Asia Pacific ........................ 17% 16% 15%
Total Revenues by Business:
Software ........................... $26,116 9% 9% $ 24,031 17% 15% $ 20,625
Hardware Systems ................... 6,302 -9% -10% 6,944 203% 195% 2,290
Services ........................... 4,703 1% 1% 4,647 19% 17% 3,905
Total revenues .................. $37,121 4% 4% $ 35,622 33% 30% $ 26,820
% Revenues by Business:
Software ........................... 70% 68% 77%
Hardware Systems ................... 17% 19% 9%
Services ........................... 13% 13% 14%
(1) Comprised of Europe, the Middle East and Africa
(2) Asia Pacific includes Japan
Fiscal 2012 Compared to Fiscal 2011: Excluding the effect of foreign currency rate fluctuations, the increase
in our total revenues in fiscal 2012 was primarily attributable to growth in our software business’ revenues,
partially offset by a reduction in our hardware systems business’ revenues. Excluding the effect of currency rate
fluctuations, the Americas contributed 65%, EMEA contributed 8% and Asia Pacific contributed 27% to our total
revenues growth.
54